Works on SC version 877 and later. Might work on some earlier versions.
This spreadsheet study calculates 12 Profit/Loss data, 6 based on the Last price, and 6 based on the Bid (if long) and Ask (if short). These are the 12:
-Currency
-Points
-Points - ignore quantity
-Ticks
-Ticks - ignore quantity
-Currency - after commissions
-Currency (bid/ask)
-Points (bid/ask)
-Points - ignore quantity (bid/ask)
-Ticks (bid/ask)
-Ticks - ignore quantity (bid/ask)
-Currency - after commissions (bid/ask)
You can option it to calculate either the Open P/L (SC's 'P/L' in the trade window) or the Open + Daily Closed P/L (SC's 'Net P/L' or 'NPL'). It does not calculate only the Daily Closed P/L (SC's 'Daily P/L' or 'DPL').
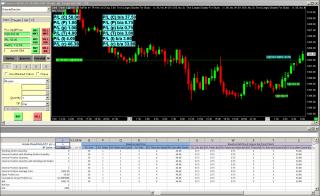
-This is a standalone study that does not require any other studies for its calculations, but it is intended to be used with the Text (Large) Display for Study study, so that you can display any/all of the 12 values anywhere in the chart region. The chart in the pic is only an example.
Instructions:
-Unzip the attached file, put the contents in your Sierra Chart \data folder.
-Focus your chart, click on Analysis >> DailyPL-
-When asked 'Clear existing studies on chart?' , choose No.
-On the spreadsheet, in cell J1, enter 'y' to add the Daily Closed P/L to the Open P/L, or enter 'n' for only the Open P/L.
-On the spreadsheet, in cell J2, enter your round trip commissions.
-It is recommended that you use the DailyPL-.StdyCollct file because it loads the correct spreadsheet study and contains the correct settings.
-This spreadsheet study uses the Spreadsheet System for Trading study because it the only study that has the required outputs. To assure that it does not cause erroneous entries, autotrading has been disabled in cell J28. Furthermore, do not put any formulas in columns K,L,M,N.
Category Sierra Chart
|
|
|


