Welcome to NexusFi: the best trading community on the planet, with over 150,000 members Sign Up Now for Free
Genuine reviews from real traders, not fake reviews from stealth vendors
Quality education from leading professional traders
We are a friendly, helpful, and positive community
We do not tolerate rude behavior, trolling, or vendors advertising in posts
We are here to help, just let us know what you need
You'll need to register in order to view the content of the threads and start contributing to our community. It's free for basic access, or support us by becoming an Elite Member -- see if you qualify for a discount below.
-- Big Mike, Site Administrator
(If you already have an account, login at the top of the page)
Observed something very interesting in ZB today and was wondering if anybody has seen this before?
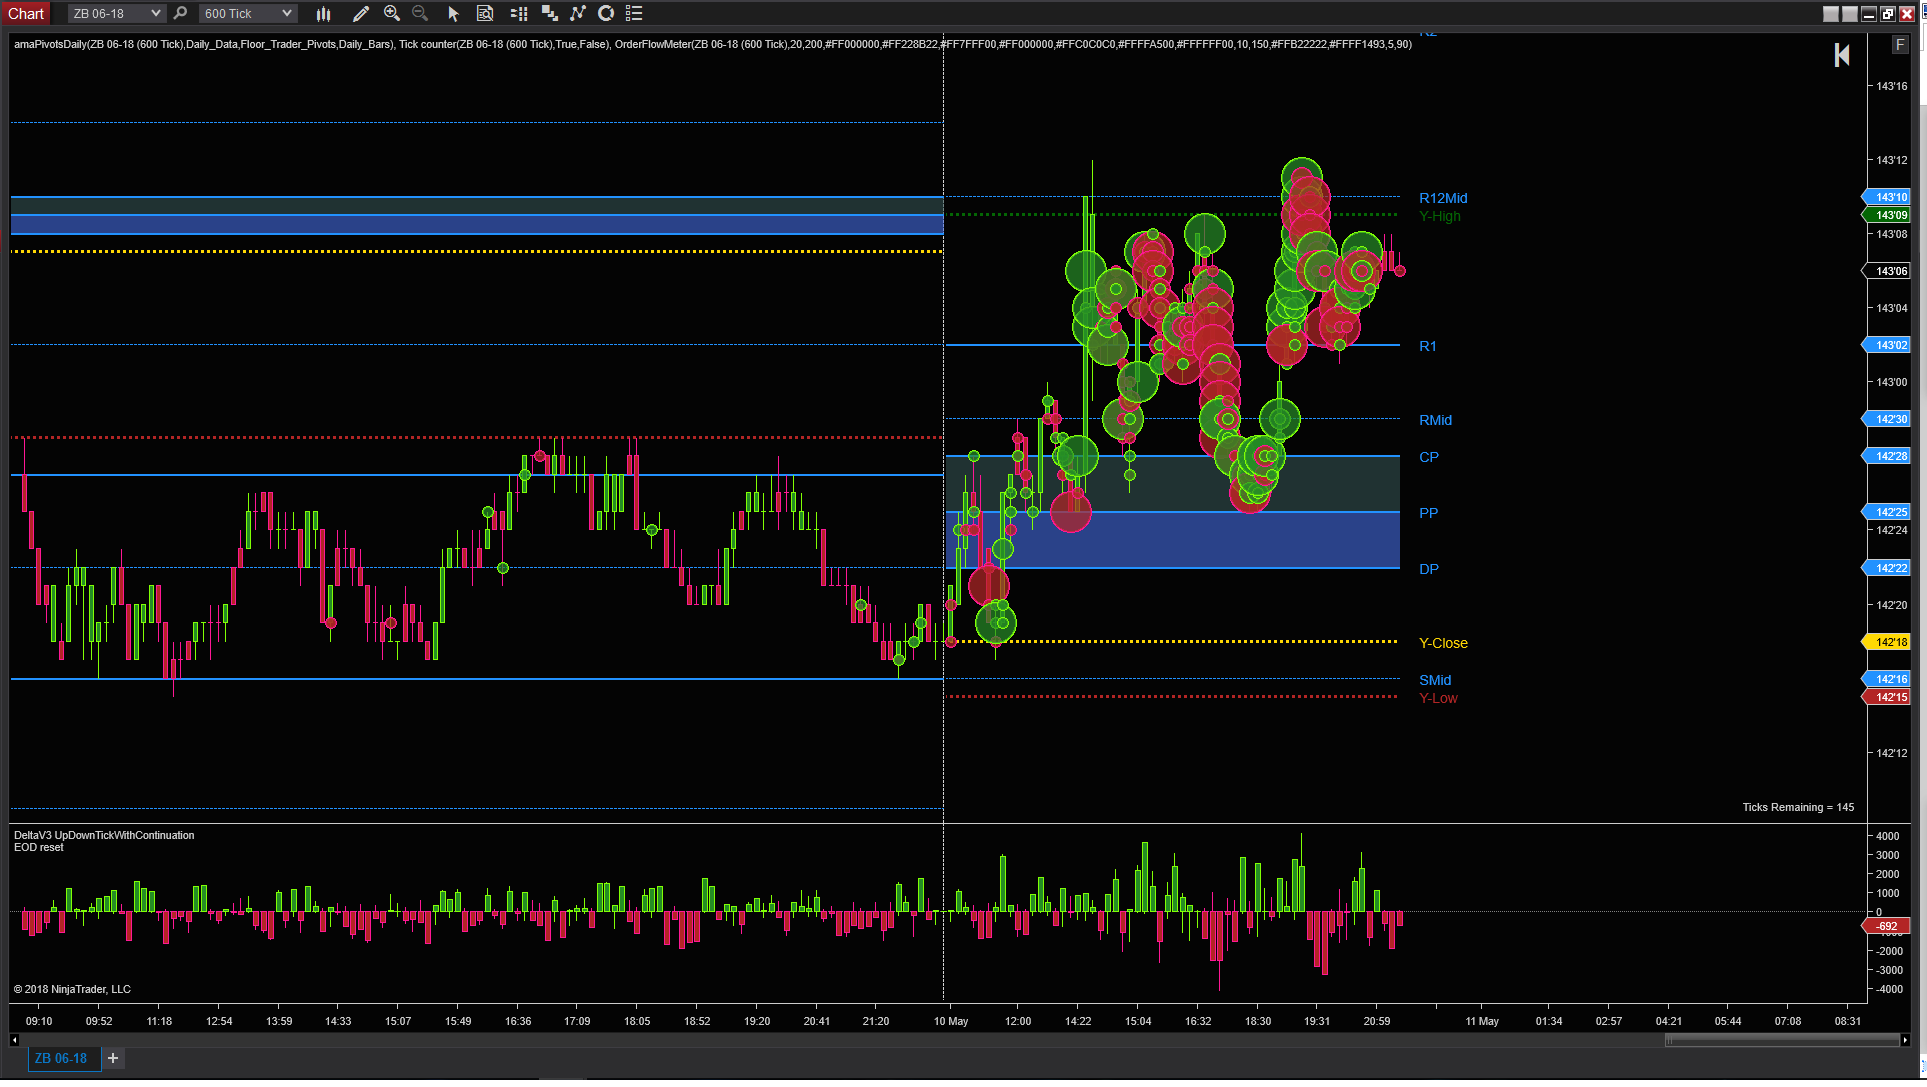
To give a bit of context on the attached charts....The chart is a 600 tick chart, the bottom indicator is the cumulative delta of volume, the circles are drawn based on volume traded at price and the lines are floor trader pivots.
The below screenshot shows a normal day in ZB. Some small, medium and large volume traded at support and resistance etc. Normal run of the mill stuff.
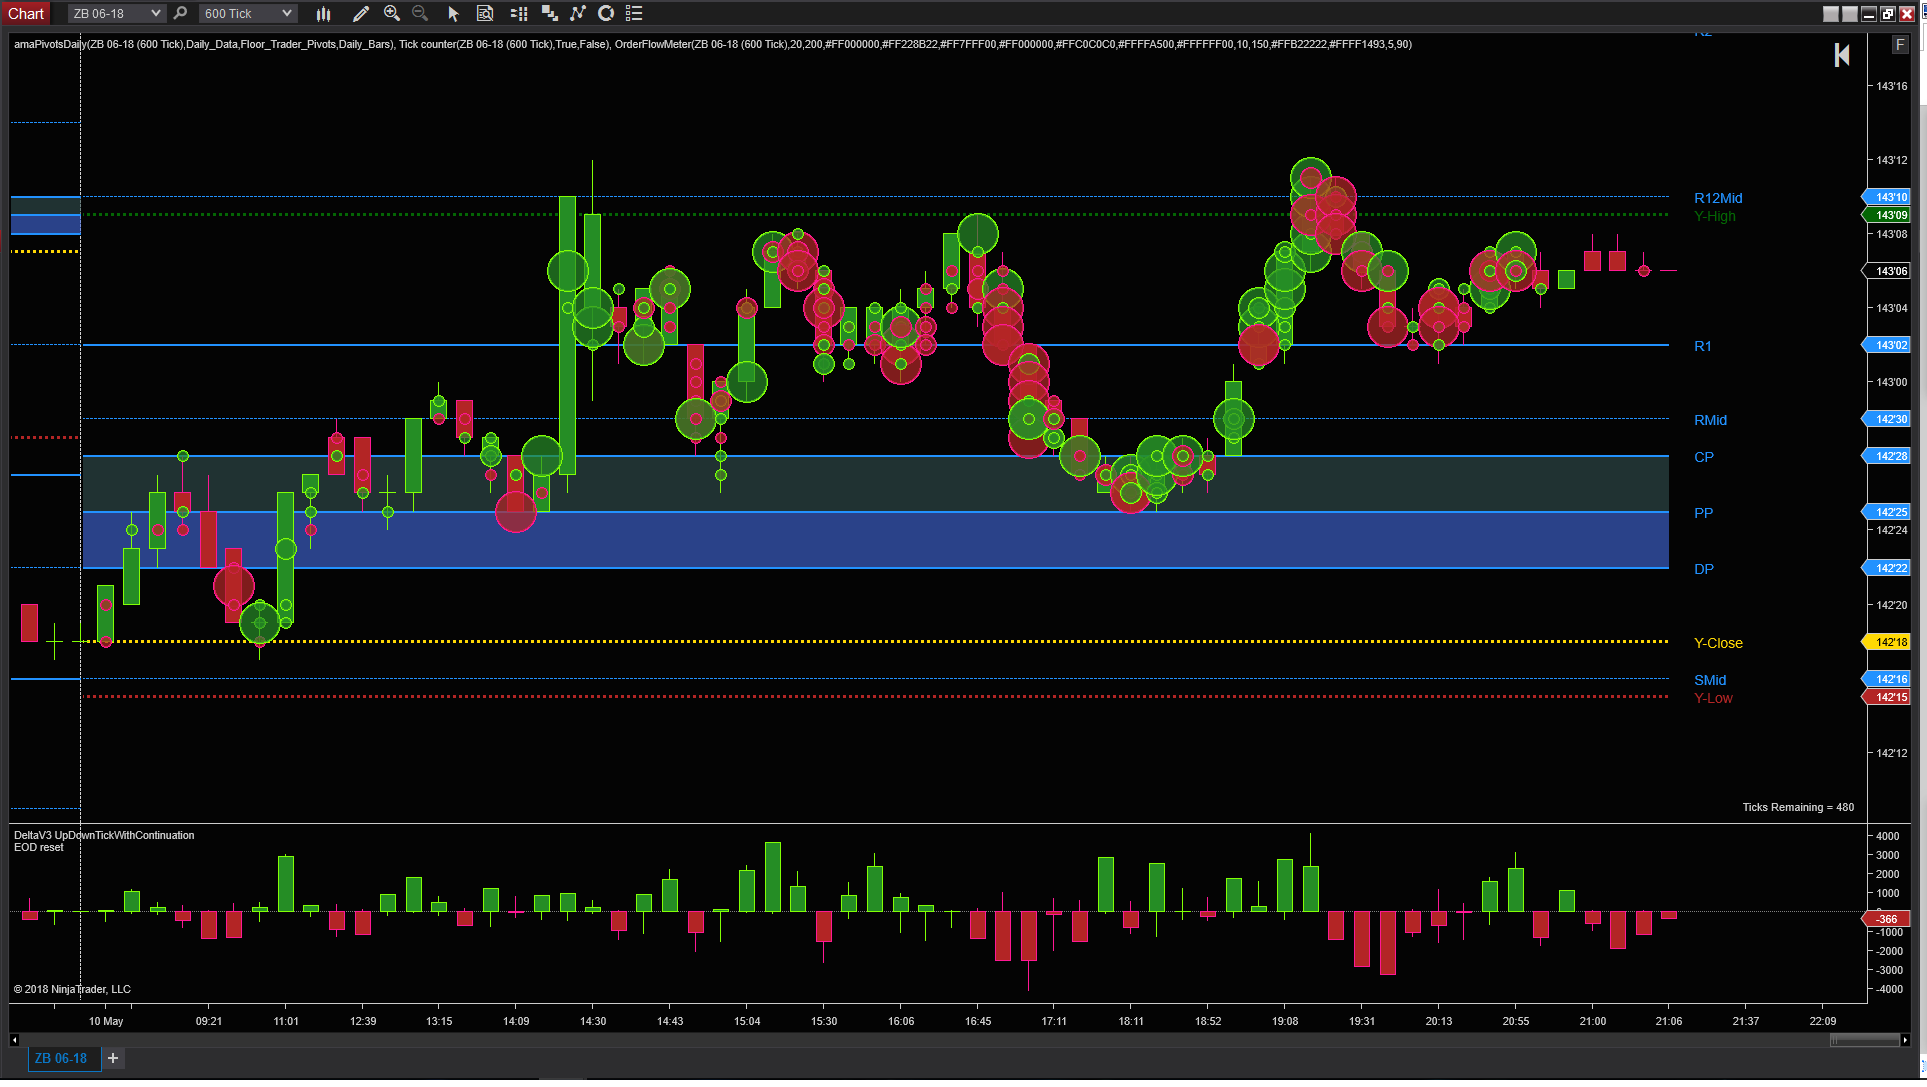
Today though.......look at the volume traded all over the place and the difference in delta compared to other days.
Weird Volume
Zoomed in to today only
At first I thought my data feed must be wrong. I cleared my Ninjatrader cache, deleted all historical data etc. etc. but it comes back the same every time.
The other thing that was interesting for me was that despite the apparently large volumes, the range that we saw was not overly exaggerated and no trend formed. Almost as if all the big volume balanced each other out.
Does anybody have any idea what happened to ZB today?
Trade Well,
Popsicle
Can you help answer these questions from other members on NexusFi?
There was a ton of interest on the news release this morning. I have no idea why it was so crazy, but it just was. You're seeing large volume all over the place simply because there were a lot of traders (or a couple of large guys, more likely) who were active all day. We also had a 30y auction today so that might be why you see volume later in the day as well.
Don't kick yourself over this! I've spent hours wondering "Did hedge funds sell it today? Why didn't the ES return to VWAP? The 21 EMA held today--that has to mean that they bought it!", when frankly, it doesn't really matter. When you're looking to enter a position, the only thing that matters is the orders that are hitting. Do people want to trade right now? That's all you need to worry about.
On Tuesday after we had that initial move down we saw a ton of volume trade when it balanced out. This could be related to the auctions we had this week, and I'm sure there's some options involved too. The on Wednesday we had the CPI data which resulted in a huge volume spike. Today on Friday we continued to have some massive volume traded, and the book was extremely thick. We also saw some movement in spreads.
It made trading difficult this week, but I was able to get 8 ticks on ZN over the week. I've been watching for a year and haven't seen anything like it. We'll see if Monday reset things or not.
I'm not that familiar with the cumulative Delta volume calculation and how it tabulates it's values.
Block trades have created issues for me with my indicators as this trade volume will show in my time sales windows and but NOT register in the chart's traded volume.
I saw a 9600 contract trade in my time sales but yet the chart's volume on that 5 min candle only had 2600 contract volume.
What are block trades?? They are trades that happen between two parties that don't qualify as Exchange traded volume. Google it to understand it better than I said.
I've become discourage some relying on my volume analysis, so much secret stuff taking place.