Welcome to NexusFi: the best trading community on the planet, with over 150,000 members Sign Up Now for Free
Genuine reviews from real traders, not fake reviews from stealth vendors
Quality education from leading professional traders
We are a friendly, helpful, and positive community
We do not tolerate rude behavior, trolling, or vendors advertising in posts
We are here to help, just let us know what you need
You'll need to register in order to view the content of the threads and start contributing to our community. It's free for basic access, or support us by becoming an Elite Member -- see if you qualify for a discount below.
-- Big Mike, Site Administrator
(If you already have an account, login at the top of the page)
Whether we like it or not, the $600 billion QE2 has begun with the Fed conducting almost daily POMOs and as will be the case the Monday after Thanksgiving, two POMOs conducted in one day. Unlike September and October when traders front-ran the Fed and their 2-3 times weekly excursions into the open market, traders appear to be taking profits from their earlier front-running purchases in treasuries and equities, by selling into the Fed's outright treasury coupon purchases.
Bernanke has steadfastly maintained throughout the QE2 debate that his intentions were to prevent a Japan style deflation, and to force investor's out of treasuries into riskier assets, i.e., the equity market. He hoped this would in turn, create a wealth effect resulting in more consumer spending, which would in turn, reflate the economy. In addition, continued low interest rates would help ameliorate the interest payments on the debt service of the federal deficit. Interest now eats up nearly half the government’s income tax receipts.
As a result of Fed policy, a continuously falling dollar and near 0% interest rates, created a dollar carry trade that produced various unwanted results; surging commodity and currency prices abroad, a widening trade gap, and the expatriation of “hot money”. While the anticipated effects from QE2, was a continued decline in the U.S. dollar, Bernanke felt that the "benefits" of renewed inflationary expectations, continued low interest rates, and rising equity prices would be worth the risks incurred.
The actual effects of the second round of quantitative easing has been rising interest rates, a flight to the dollar, falling commodity and energy prices, and a narrowing of the yield curve. Are these effects the result of profit taking/short covering, or are we at a turning point in the markets, where new paradigms are emerging and existing trends are reversing?
While the answer to this question should become more apparent in the following days and weeks ahead, it’s mere postulation suggests that the market is at a major inflection point. Contrary to what was anticipated by Bernanke and the Fed, interest rates are rising, the yield curve is narrowing, the dollar is getting stronger, commodity prices are falling, and the strength of the bounce and seasonality in equities is in serious doubt. The current market’s action as a result of QE2 does not point to inflation, but rather to what it was intended to prevent...deflation.
One of the trading opportunities that has presented itself as a result of these macroeconomic changes is the narrowing of the yield curve or the NOB ( 10 Year Notes over 30 Year Bonds). In a normal yield curve, short-term rates are lower than long term rates. It is assumed that the Fed attempts to keep the short end down to spur economic activity, and that bond investors demand higher rates further out the curve to compensate for inflation. It is also assumed that the Fed and short end of the curve is the determinant of the slope of the curve. In general, bond traders link the dynamics of the yield curve to their expectations of the future economy. When the yield curve flattens it is usually accompanied by deflation or steady and low inflation and a slowing of the economy, and a steeping of the yield curve is usually the result of an accelerating economy and inflationary expectations.
As a result of QE1 we witnessed a prodigious equity rally and a yield curve on steroids as the 10/30 steepened to historic levels. From a trading perspective this meant you wanted to be long the short end (falling rates) and short the long end (rising rates). In the case of the NOB, you would be long the 10 Year (ZN), and short the 30Year (ZB) or long the NOB.
From a mean reversion standpoint alone traders should have been looking for the curve to narrow, but the Fed had stated that one of the goals of QE2 was to lower yields(keep rates down) and increase inflation expectations, so a continued steeping of the curve was not only highly possible, it was expected.
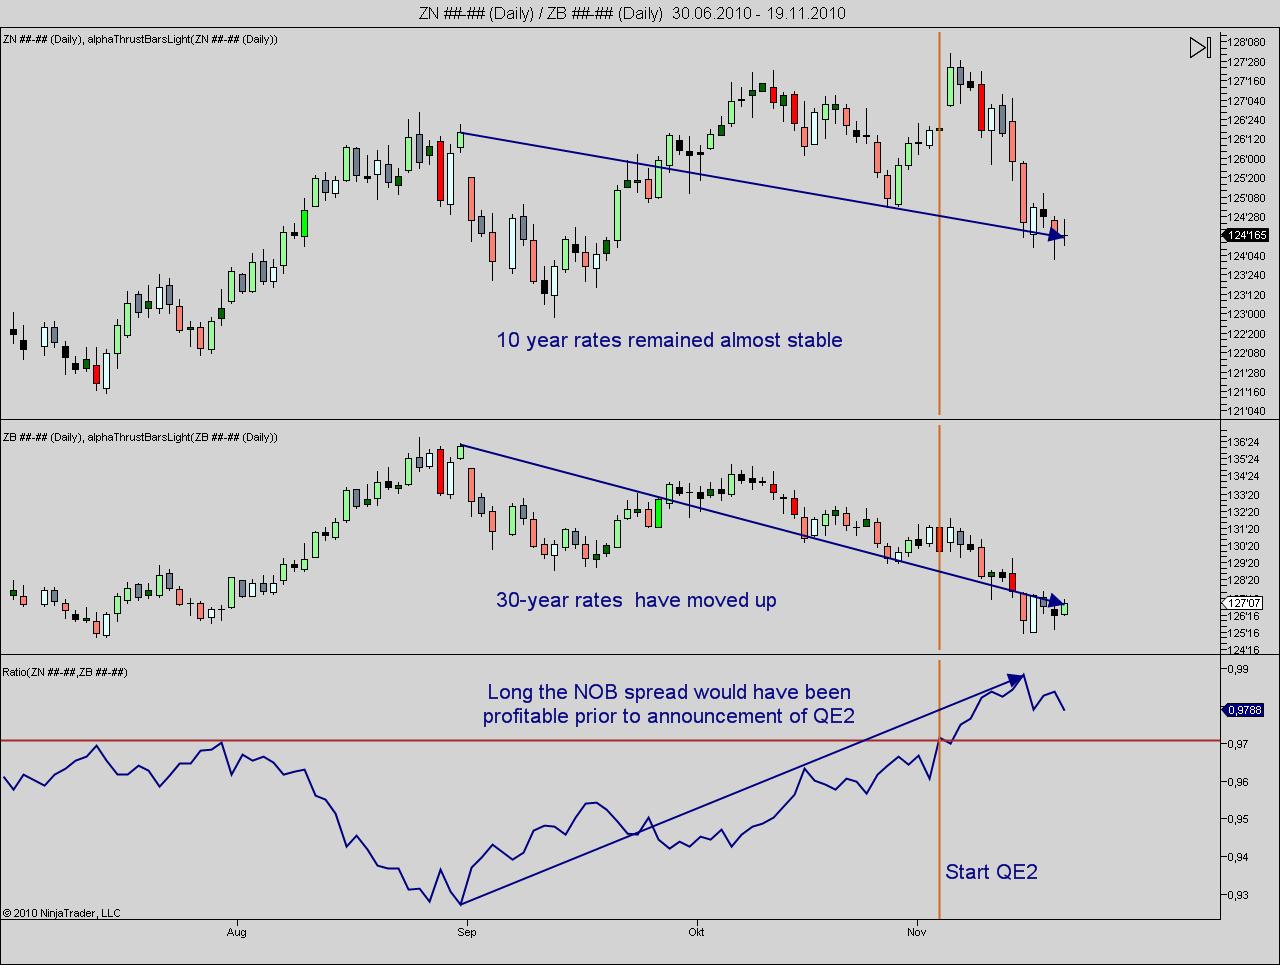
But, the market has thrown a (yield) curve ball! Post QE2 the yield curve has been coming in, instead of going further out, and selling the NOB is the trade that has been working. The fact that rates are rising despite the Fed’s campaign to buy $600bln in Treasuries is amazing. Yet once again, it is a testament to the pricing power of the markets. Central bank intervention can only work for so long; eventually the underlying trend will prevail, and if the supply demand factors call for higher rates, then higher rates will prevail.
If you look at the NOB spread, it started to rise in the beginning of September. The first chart below shows that interest rates for bonds moved higher, while the rates for treasury notes remained almost stable.
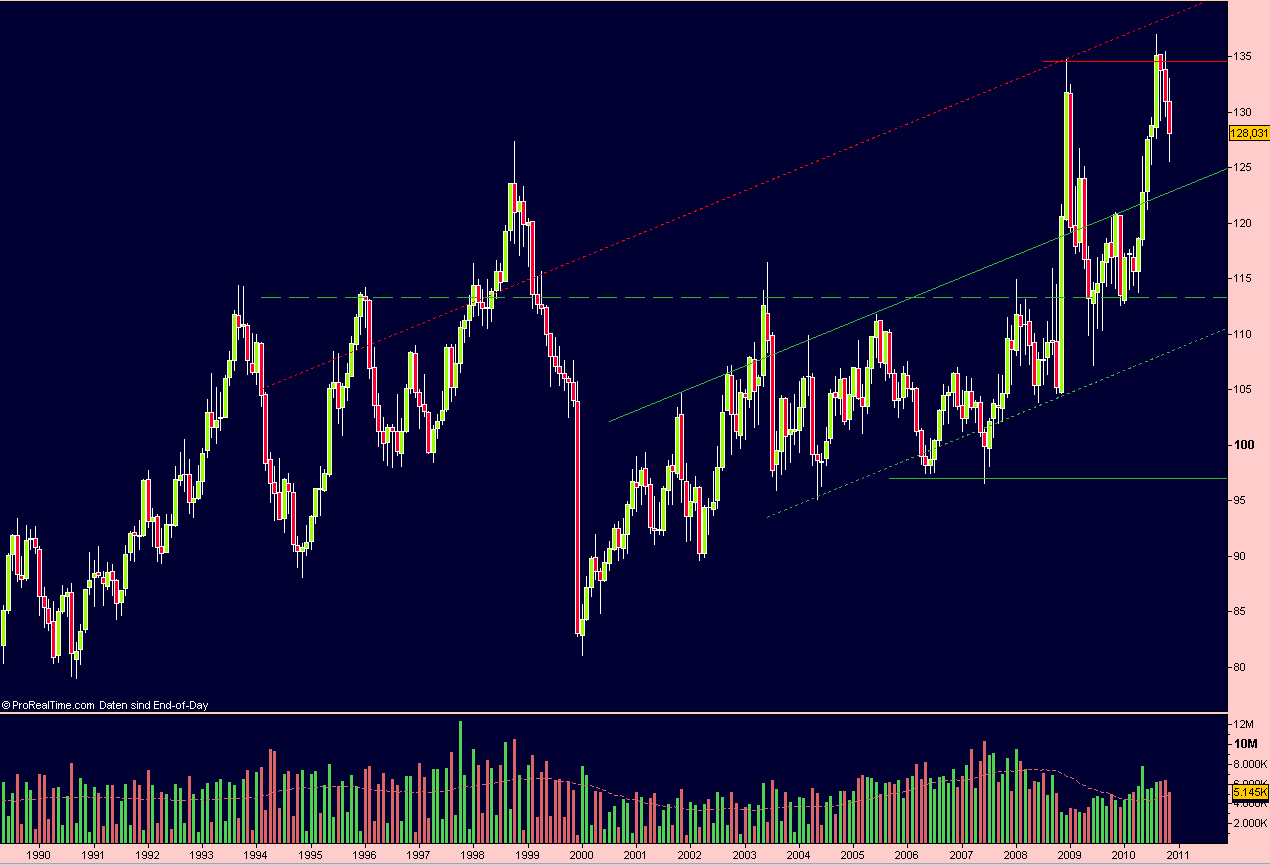
QE1 was all about injecting liquidity to compensate for the failure of the banks of creating money. QE2 aims at avoiding deflation as opposed to the last decade in Japan, so the price to be paid is inflation in the longer run. The sell-off in government bonds has already taken place. QE2 purchases starting in November might temporarily halt the increase in bond rates, but should not stop it. Anyhow bond rates have been at their historical lows, as shown on the second chart, so whatever the FED is doing, the rates will go up.
The question is only how long it will take to move up the rates. During the lost decade in Japan, rate expectations have been consistently higher than the rates, meaning that the forward rate ratio was greater than one but nothing happened. Japan's case may be different, government debt is running high, but the share of foreign bond holders is not comparable to the large holdings of US bonds by Asian and Middle-East investors.
NT 7.0 crashed on 2 data-series, perma-crash on start, need to re-install NT. So another software here for the bond prices. Monthly chart 1990 -2010.
Lacking a bit of education, I cannot interpret that last chart you posted. What is the scale about?
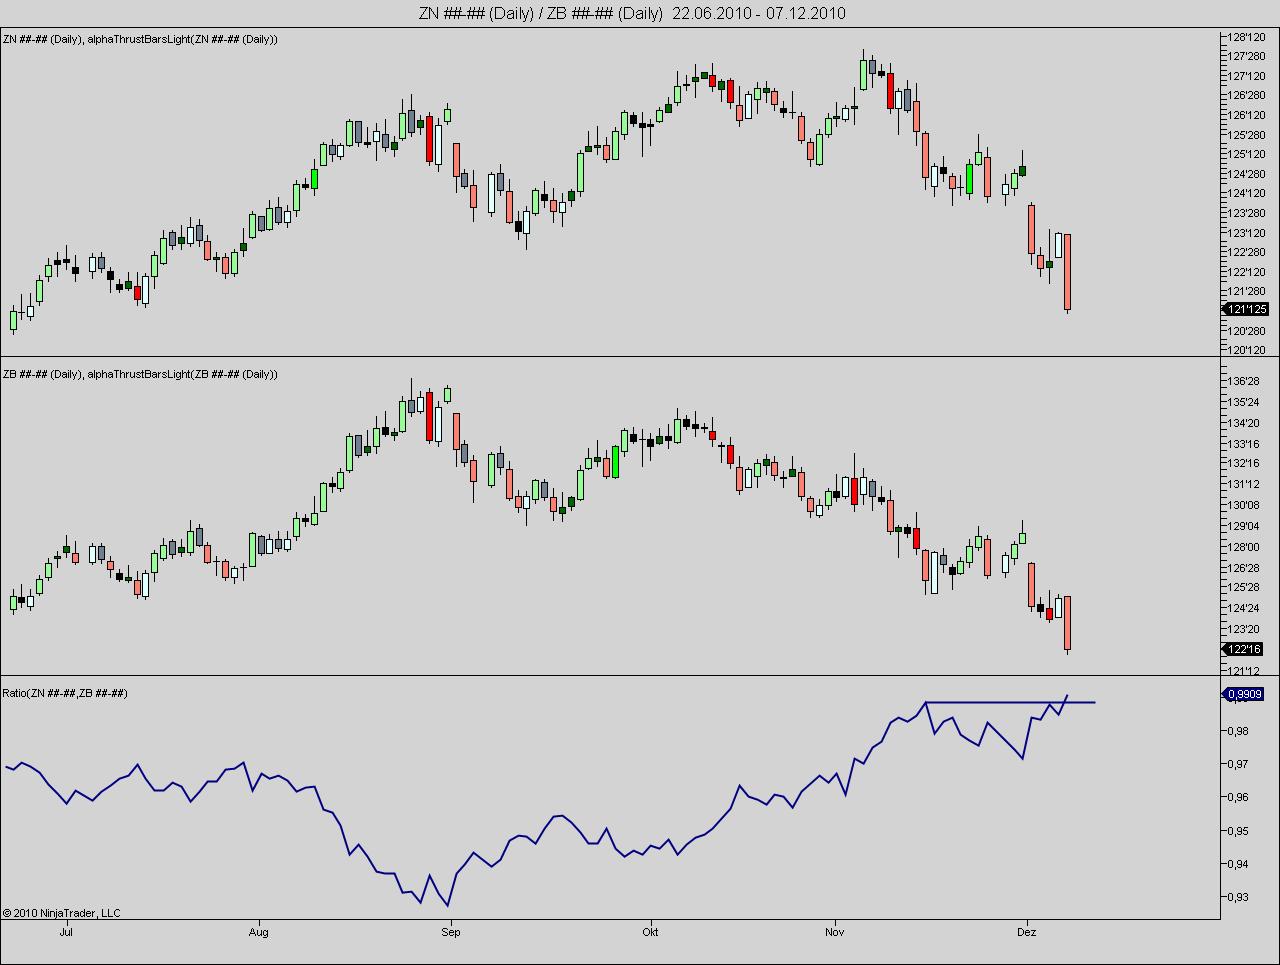
Noticed that the NOB spread has been rising since December The chart shows that rates are also rising.
If I think about it, the NOB spread has two dimensions:
-> rising rates have a bullish impact on the NOB spread, as the bonds have higher leverage than notes
-> a steepening yield curve would also have a bullish impact
Are spread-traders holding longer term positions or just placing mean-reversion trades to arbitrage supply/demand peaks that occur in the market, for example during auctions?