NexusFi: Find Your Edge


Home Menu


MC.net: (Multi-Timeframe) EMA @ Weekly Data on Daily Chart


Discussion in MultiCharts

Updated
    1. trending_up 2,686 views
    2. thumb_up 0 thanks given
    3. group 1 followers
    1. forum 0 posts
    2. attach_file 1 attachments


Search this Thread

MC.net: (Multi-Timeframe) EMA @ Weekly Data on Daily Chart

  #1 (permalink)
 rc76 
Taipei
 
Experience: Beginner
Platform: NT
Broker: IB
Trading: ES
Posts: 8 since Jul 2018
Thanks Given: 1
Thanks Received: 2

Hi everyone,

I have two data series on a QQQ daily chart:

QQQ @ daily
QQQ @ weekly (invisible candle)

I have created a default EMA (Mov_Avg_Exponetial) with same period on both QQQ_daily and QQQ_weekly data series

EMA_daily = CYAN
EMA_weekly = RED

I have created the same EMA using ToS. (attached image).
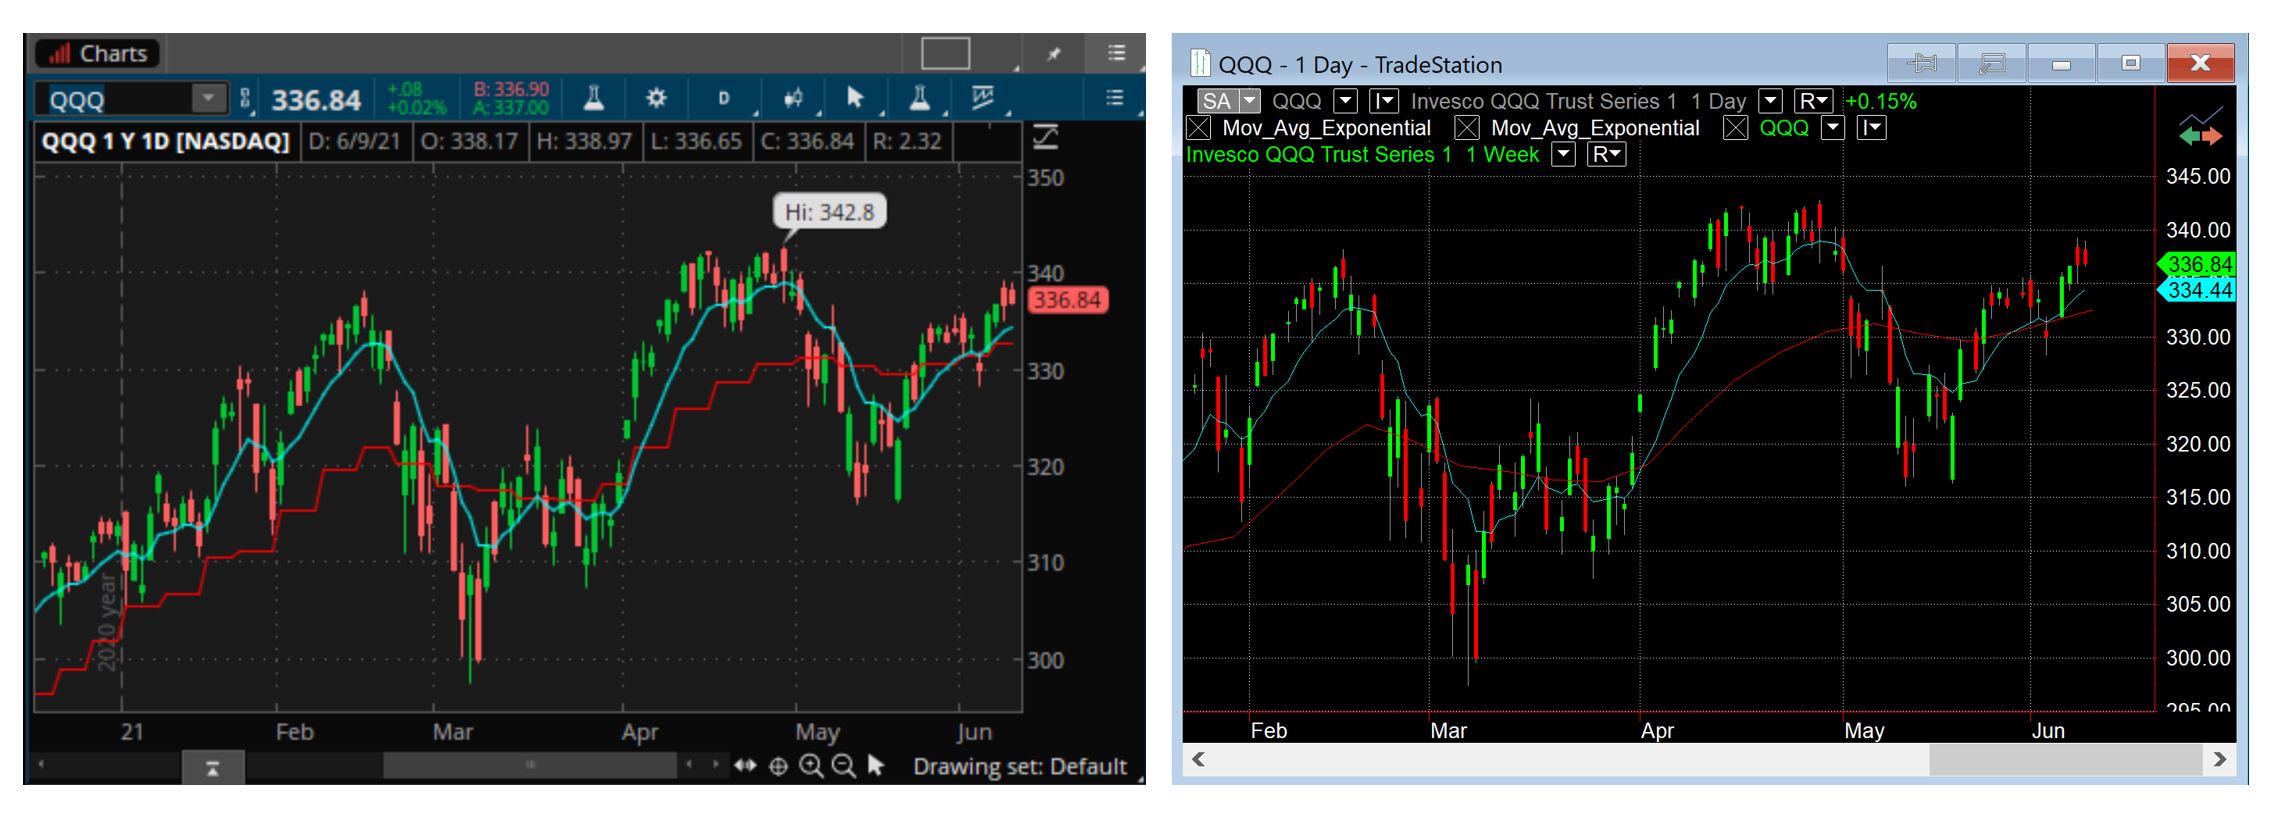


As you can see, the EMA_weekly_RED from ToS has a sort of "stepped line" instead of the "smoothed line" in MC. Why is that?

I think other trading platforms also generated this kind of "stepped line" when imposing higher timeframe lines onto lower timeframe chart.

Is there anyway we can make the MC's EMA to generate the same "stepped line" as in ToS?

Thanks guys so much for your kind inputs and helps!

Started this thread Reply With Quote


Last Updated on June 12, 2021


© 2024 NexusFi™, s.a., All Rights Reserved.
Av Ricardo J. Alfaro, Century Tower, Panama City, Panama, Ph: +507 833-9432 (Panama and Intl), +1 888-312-3001 (USA and Canada)
All information is for educational use only and is not investment advice. There is a substantial risk of loss in trading commodity futures, stocks, options and foreign exchange products. Past performance is not indicative of future results.
About Us - Contact Us - Site Rules, Acceptable Use, and Terms and Conditions - Privacy Policy - Downloads - Top
no new posts