|
Tallinn, Estonia
Experience: Beginner
Platform: SC
Trading: NAS100
Posts: 959 since Nov 2010
|
It does not exist.
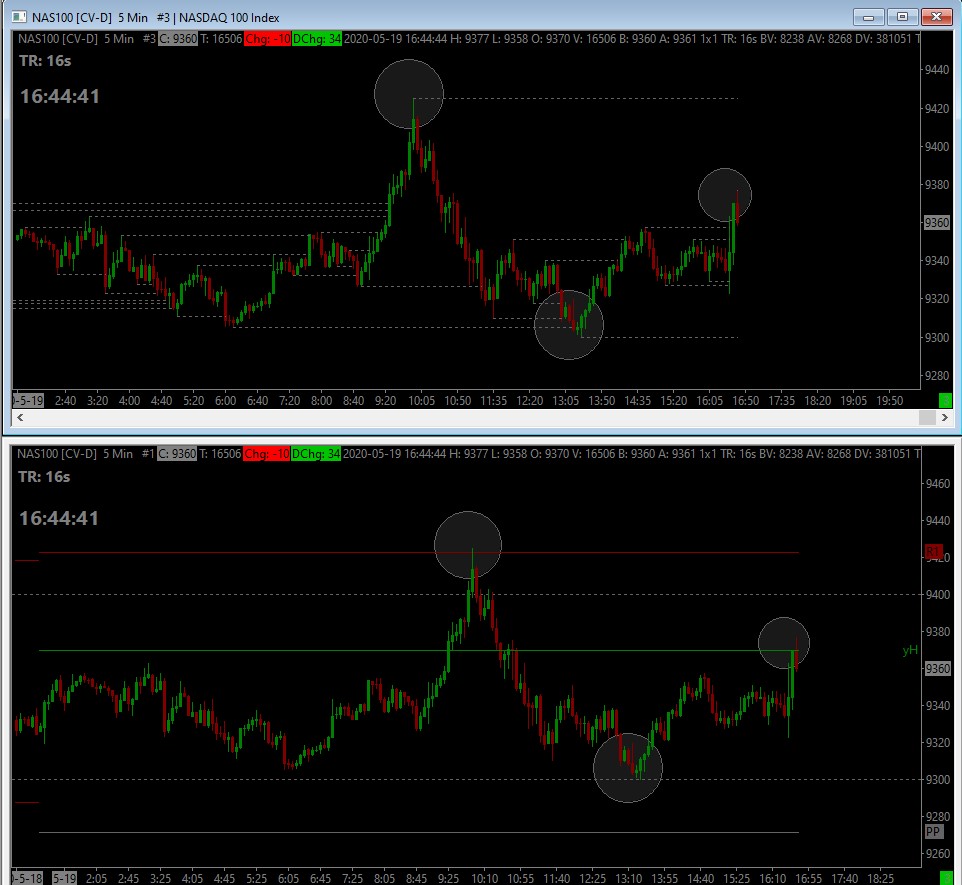
You can use built in study " Zig Zag " study to plot horizontal lines from previous swing high and low.
There may or may not be stronger support / resistance at pivot points, yesterdays high / low or round numbers.
When pivot point + yesterdays H or L + round number forms tight zone it may or may not be stronger support / resistance level.
|


