Welcome to NexusFi: the best trading community on the planet, with over 150,000 members Sign Up Now for Free
Genuine reviews from real traders, not fake reviews from stealth vendors
Quality education from leading professional traders
We are a friendly, helpful, and positive community
We do not tolerate rude behavior, trolling, or vendors advertising in posts
We are here to help, just let us know what you need
You'll need to register in order to view the content of the threads and start contributing to our community. It's free for basic access, or support us by becoming an Elite Member -- see if you qualify for a discount below.
-- Big Mike, Site Administrator
(If you already have an account, login at the top of the page)
In those volatile times some might look for a more "stable" instrument compared to crude oil or gold with their currently thin order books.
I'd like to come up with a first analysis based on the market profile respectively TPO chart for the copper futures market (symbol: HG). It might be an alternative instrument for some of you..
See the attached picture and numbers below.
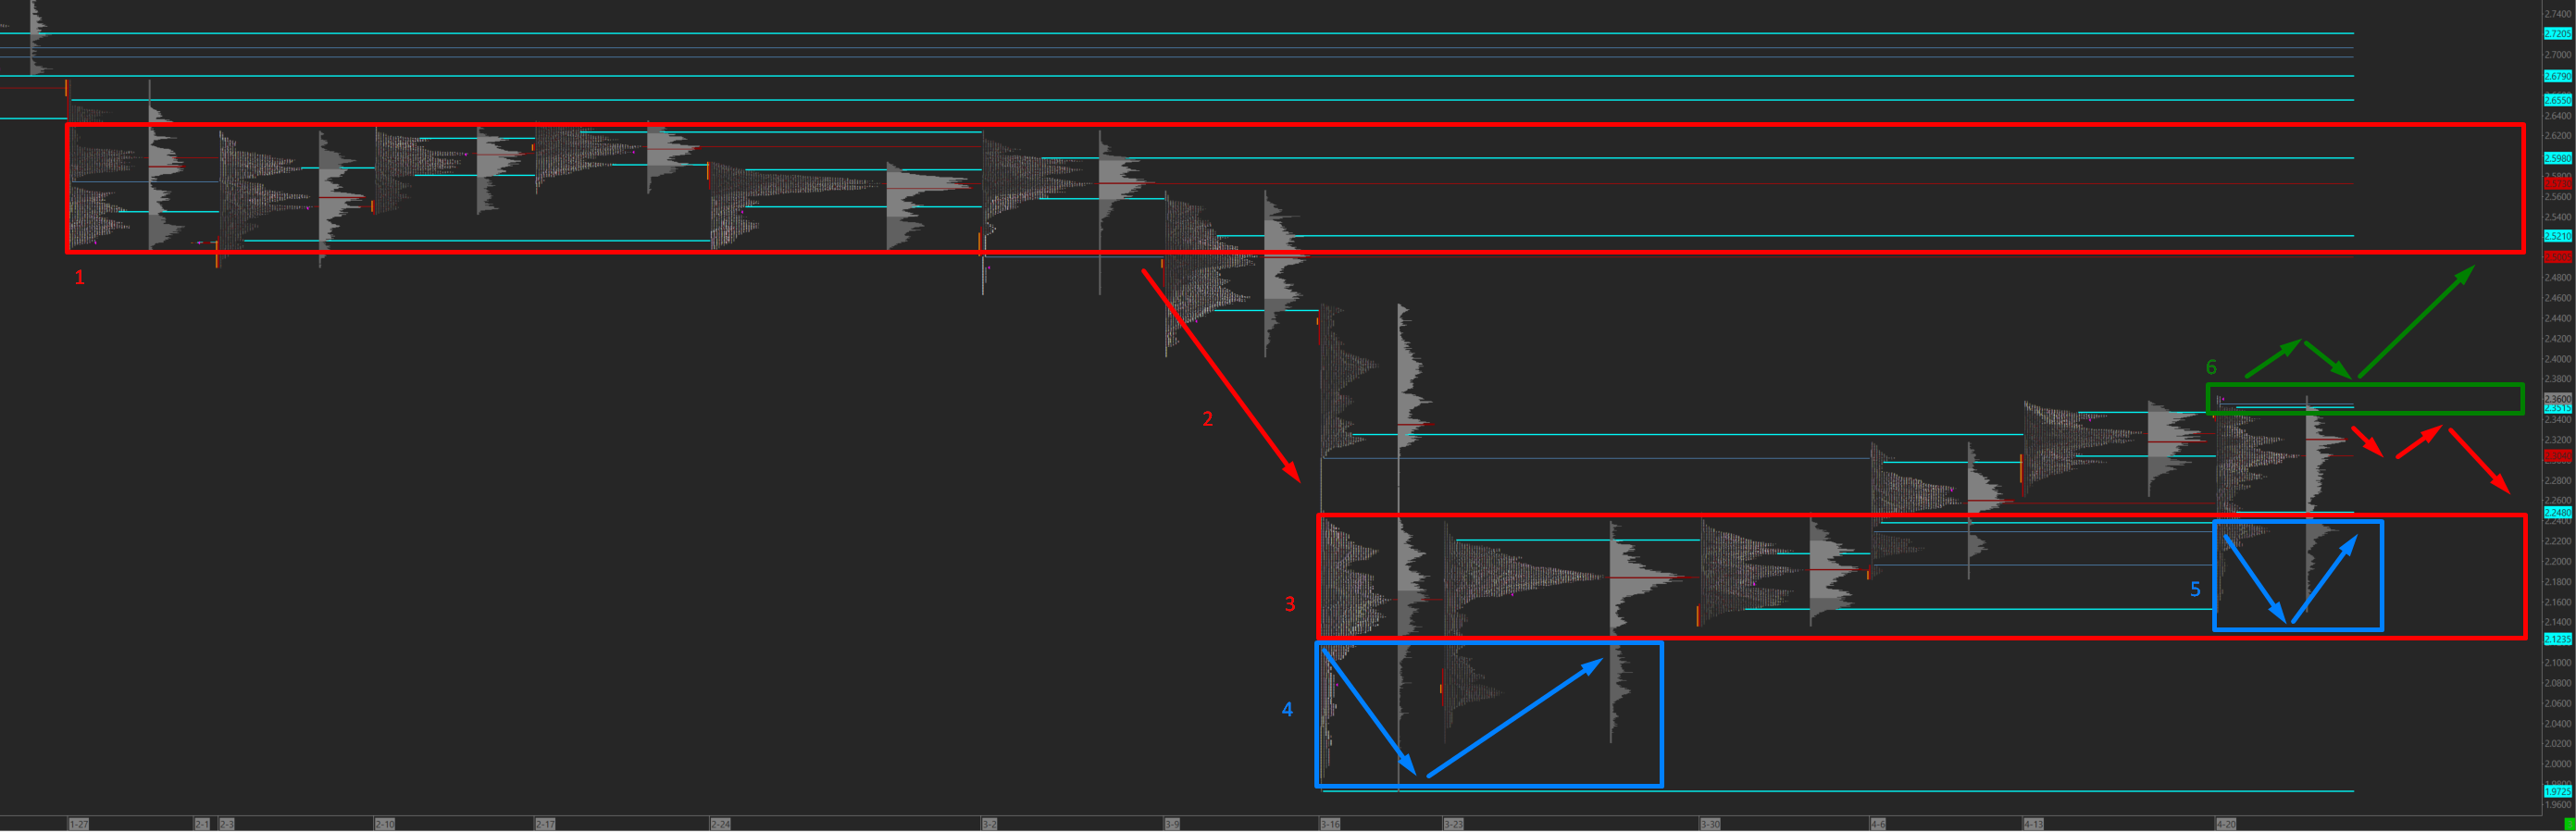
Copper was ranging sideways maintaining price levels between 2.50 USD and 2.64 USD from January until March (1). Beginning of March buyers could not hold the lower langer level anymore and the price broke on the downside significantly pushing short (2). The market reached levels at around 2.00 USD but was rejected (4) and stabilised between 2.12 USD and 2.24 USD (3).
Since price levels below the new range were rejected likelihood that the market breaks out on the upside increased. The price moved higher above that range and tested it again - but got rejected (5) and even closed a their current week's high (6).
Since price levels got rejected on the downside, probability has increased that they will test the upside - targets may be the old range from January to March. However, should be market illustrate weakness, a first target could be the previous' range top at around 2.24 USD.
Let's see where it goes - the next week(s) will tell us. Always keep both directions in mind and do not insist on one specific direction.
The copper marked remained undecided the past week. Tuesday, the market built an inside day, followed by a fake breakout on the upside.
The initial analysis remains valid waiting for prices reaching the range top on the downside or, alternatively, performing a turnaround with a target on the range bottom on the upside. However, the fake long breakout on Thursday and subsequent short push below the previous' day low indicates seller strenght.
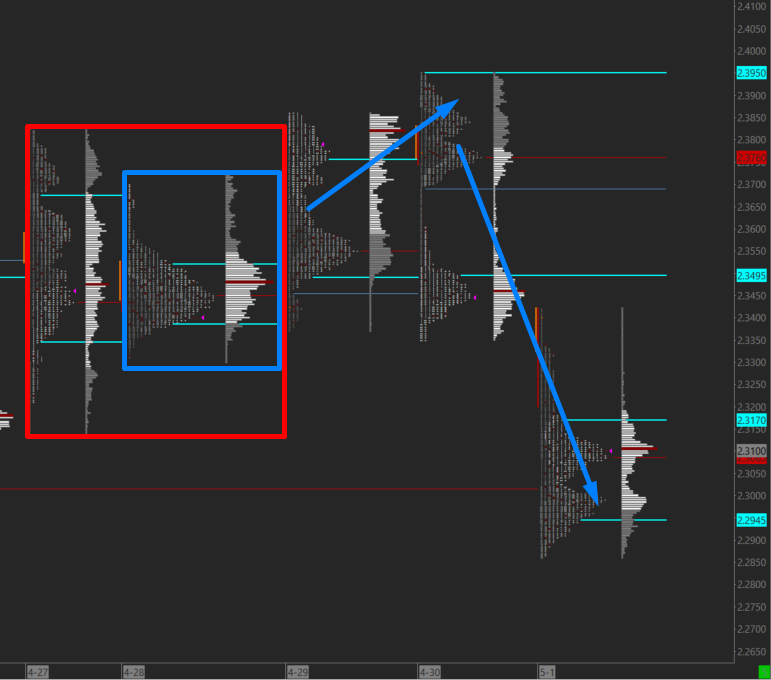
Following the initial analysis, the market created a strong range(1) which was left on the short side ( the previous posting). Having a general short context buyers gained strength beginning of the week and pushed the market through the entire range (2) forcing the sellers to close their positions which resulted in a strong long trend. The market finished this week close to the week's high.
The coming week, the range around 2.33 USD - 3.36 USD (1) illustrates a support area. Prices can bounce back here latest following the previous week's long trend with a target at the old range bottom from March (3). Should the price, however, fall below that range lower prices can be expected with a target at the old range top at around 2.24 USD (4).
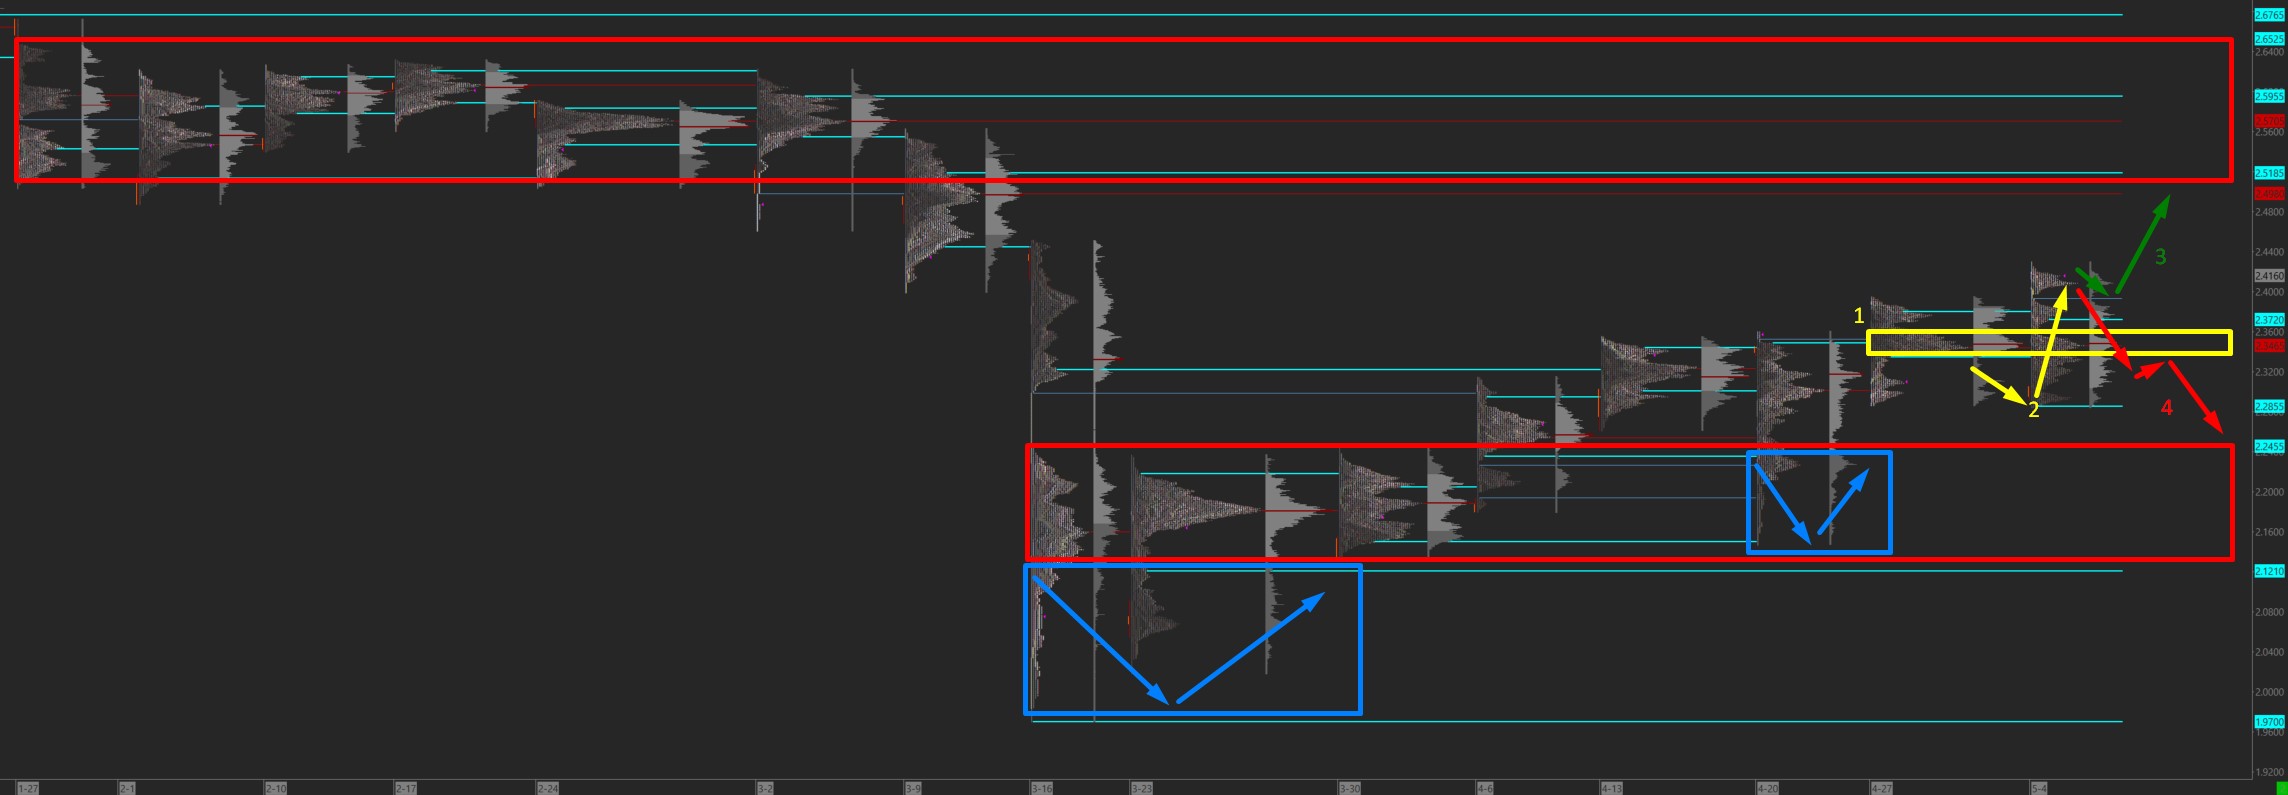
Following the initial analysis the market continued to build a range in a volatile market the past weeks (1). Last week, the market performed a strong long push accompanied by several single print areas (2) indicating buyer strength. However, the market got hold at a later stage and significant volume was created (3) illustrating seller strength. The price moved short again and closed at the initial range on Friday.
Considering a buyer perspective, the copper market may trade above the range with a first target at the last week�s rejected area at around $2.45 - $2.47 (4). In contrast, the single print areas around $2.34 - $2.37 illustrate a resistance zone. Should the market illustrate weakness and sellers are able to gain dominance the resistance zone may be broken to the downside with a first target at the old range from March / April (5).
I think lower from here. Daily time frame perspectinve. Bear market rally since the end of march but bumping into some good resistance. Overbought and momentum getting exhausted. For me to get bullish would need to see trading above 2.49 and using that as support.
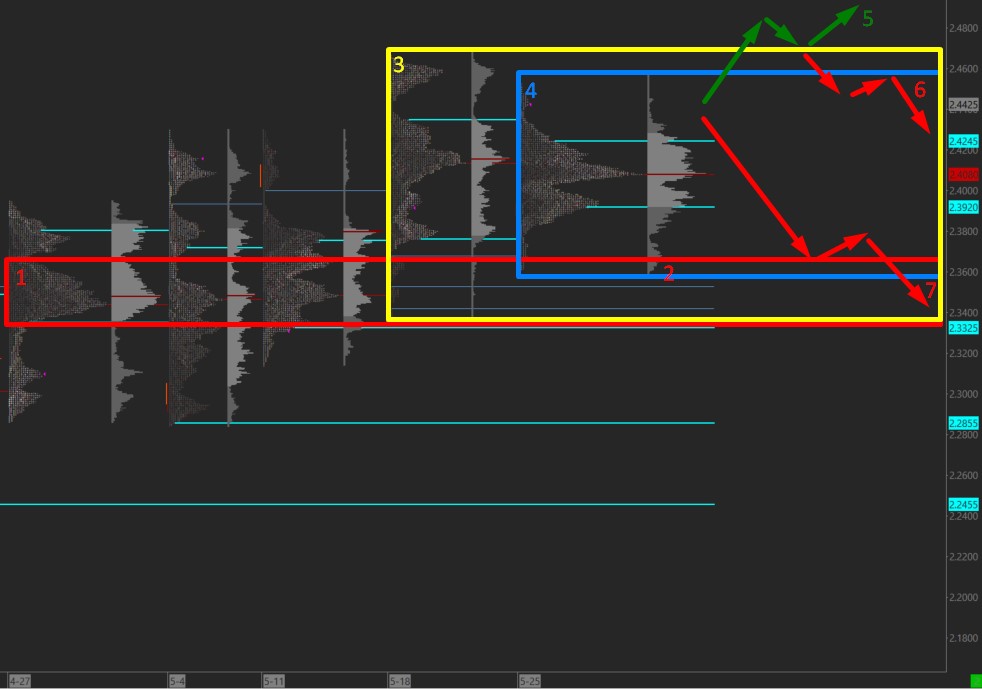
The following posting continues the previous analysis of the copper (HG) futures market based on the recent price developments utilising the weekly market profile in combination with the volume profile.
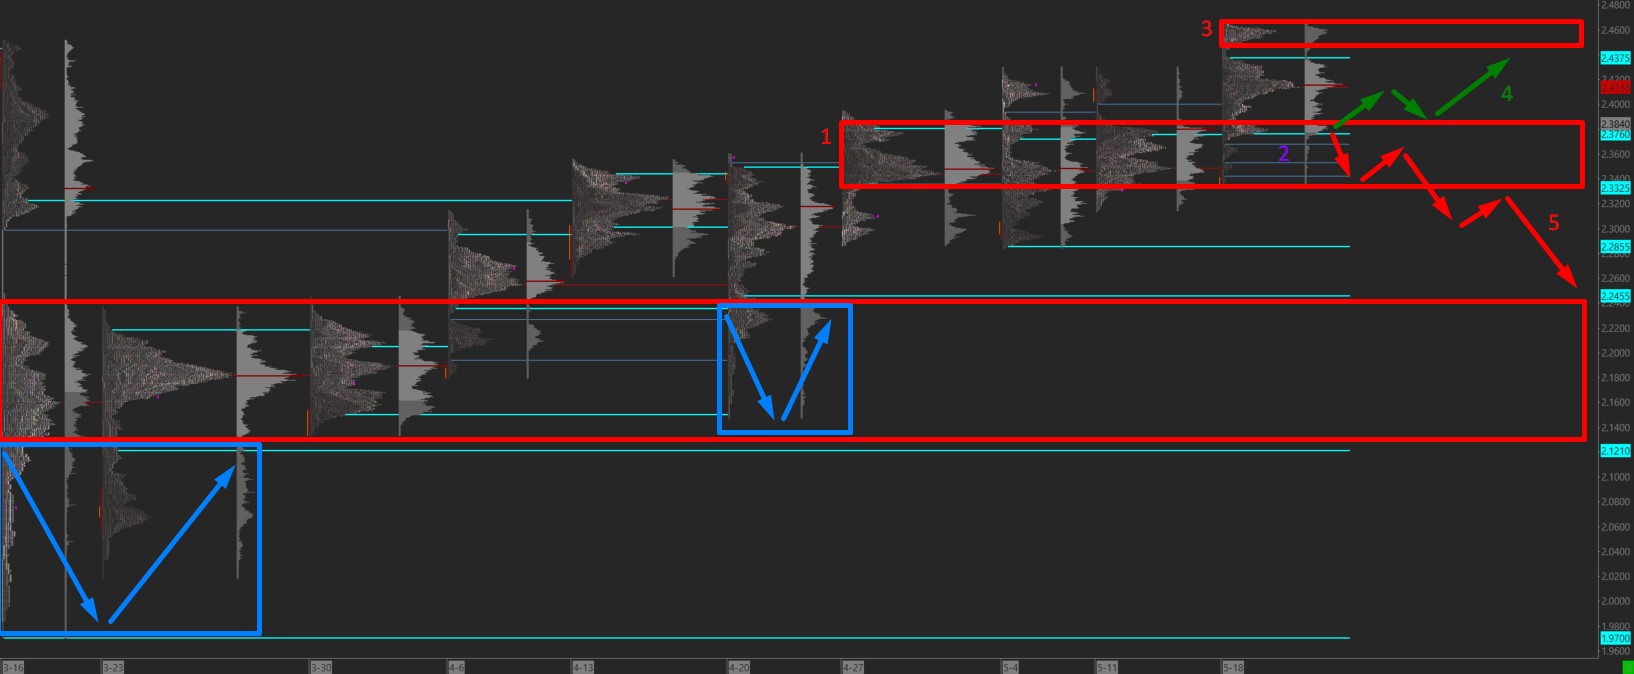
Starting point was an earlier range(1) that has been tested but got rejected immediately (2). Subsequently, the market went long and finally closed above the previous week�s value area high indicating buyer dominance. However, the previous week�s high and low have not been tested (3) resulting in an inside week (4). Such phenomenon�s illustrate uncertainty in the market where a decision can be expected within the following week.
Preferring a buyer perspective, the market can break the week�s high and continue to break to last week�s high (5) � a sustainable breakout will clearly favour long positions. On the contrary, however, inside weeks may be targets for fake breakouts. Should the market fall back into last week�s range it can be considered a fake breakout with higher probability of falling prices (6). Should the market illustrate weakness right from the beginning the last week�s low can be considered a first short target (7).
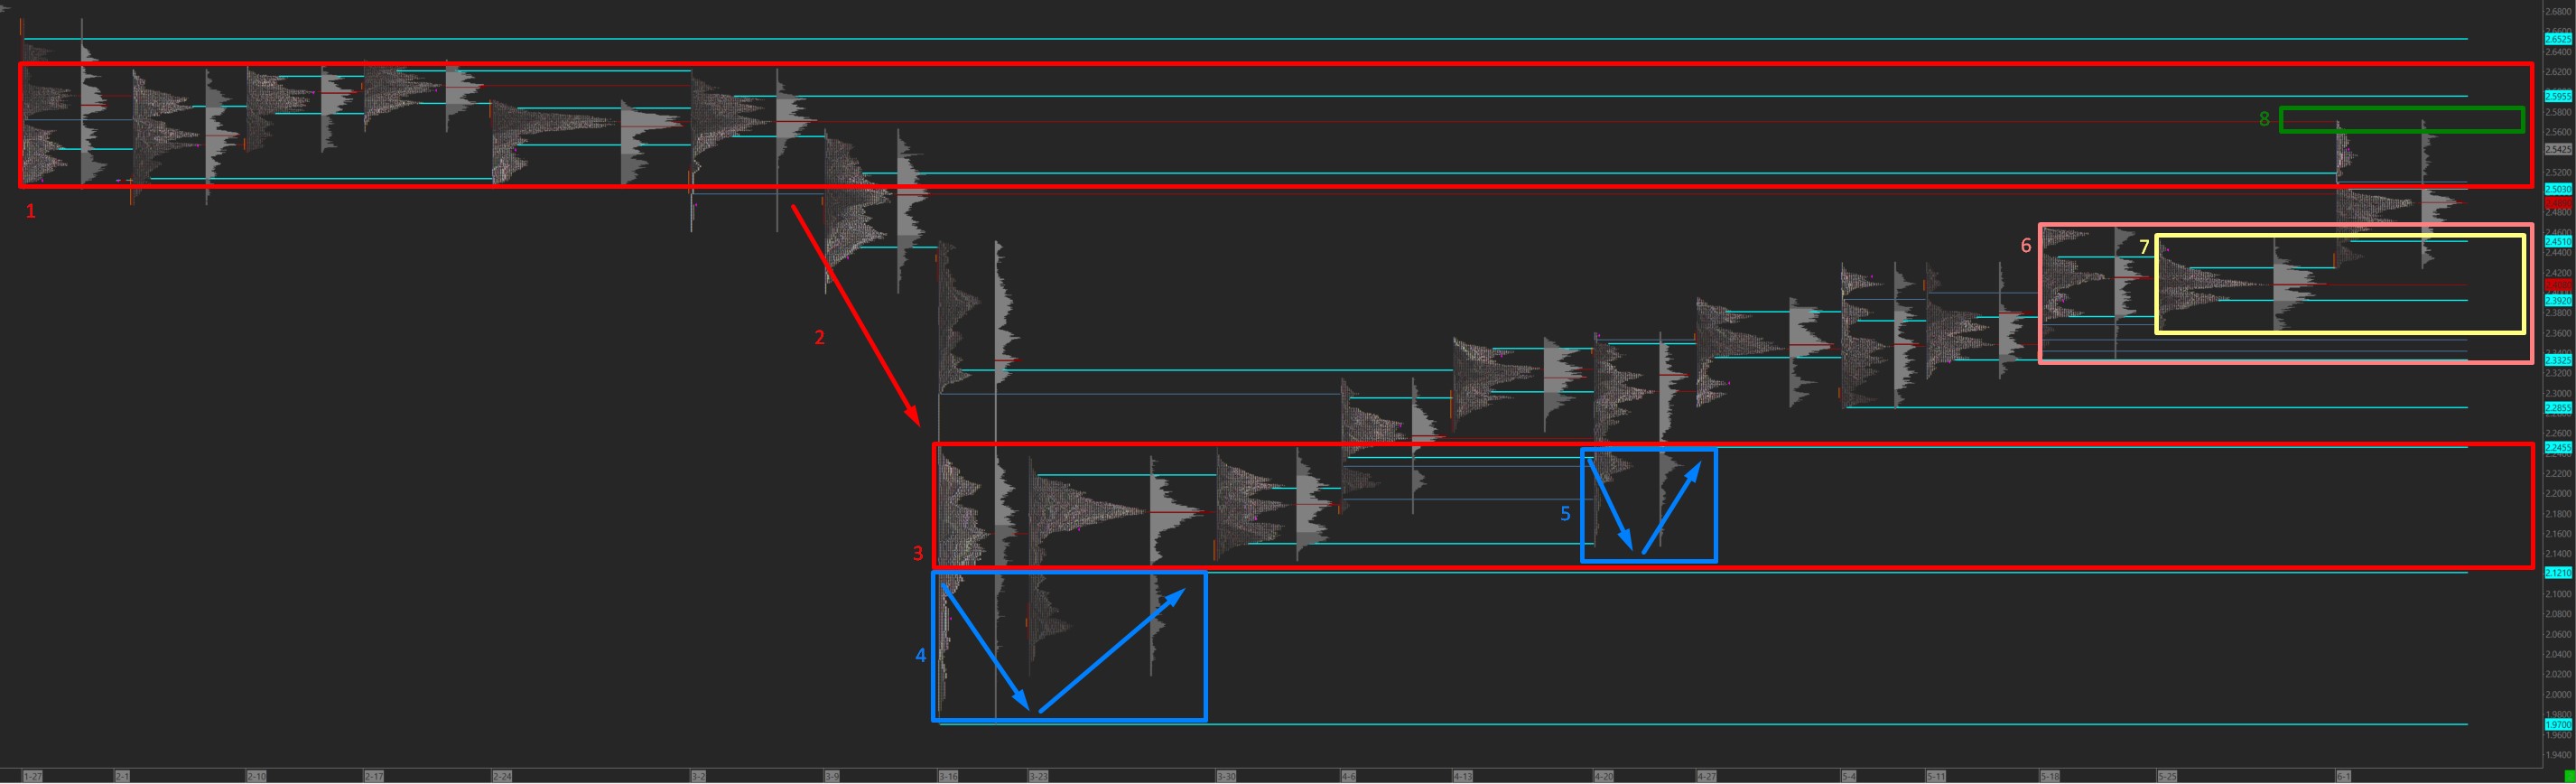
The following post finalises the initial analyses reaching its target level.
Copper was ranging sideways maintaining price levels between 2.50 USD and 2.64 USD from January until March (1). Beginning of March buyers could not hold the lower range level anymore and the price broke on the downside significantly pushing short (2). The market reached levels at around 2.00 USD but was rejected (4) and stabilised between 2.12 USD and 2.24 USD (3).
Since price levels below the new range were rejected likelihood that the market breaks out on the upside increased. The price moved higher above that range and tested it again - but got rejected (5) and even closed at the weeks high.
Followed by three volatile sideways weeks, the market built and inside week (6/7) which was, eventually, broken to the upside in a strong long trend. The price reached a naked VPOC from an earlier week (8) at 2.5705 USD and closed within the initial range from March (1).