|
Santo domingo/ Dominican Republic
Posts: 5 since Oct 2019
Thanks Given: 2
Thanks Received: 0
|
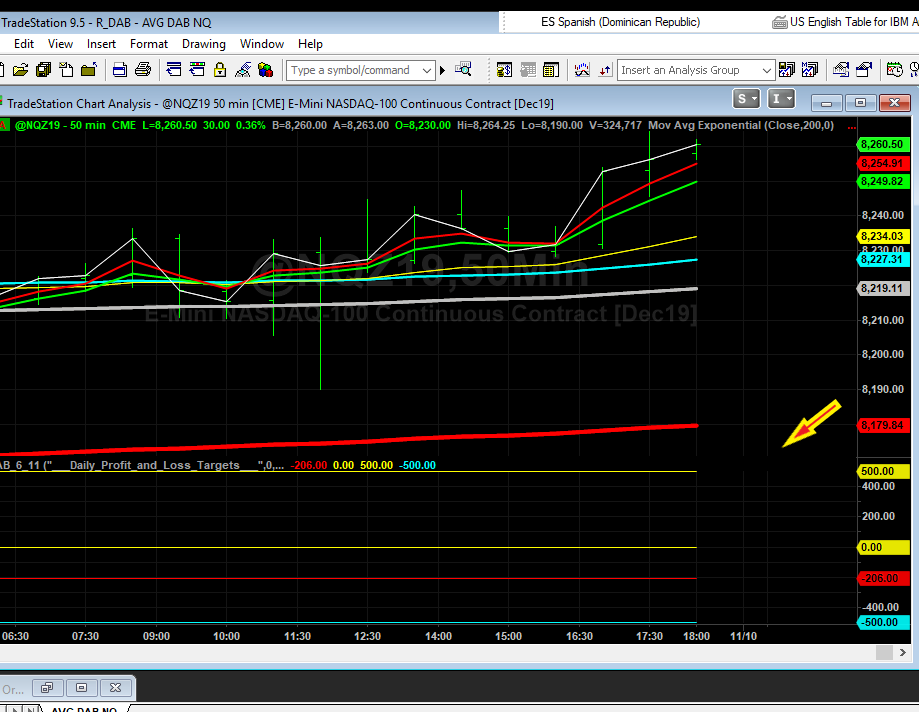
Hi, I've been working with indicators and strategies in easylanguage for a few years. Currently I want to implement an indicator that shows the limits of daily loss or gain, in reality what I need to see is the daily balance of the profir contributed by an individual symbol. I currently share with you what I have, but this only shows me the balance of the strategy, not what is really happening with the symbol. can you help me?
inputs:
___Daily_Profit_and_Loss_Targets___("___Daily_Profit_and_Loss_Targets___"),
Use_Daily_Profit_0_1 (0),
Daily_ProfitTarget( 500),
Use_Daily_Loss_0_1 (0),
Daily_LossTarget( 500),
Commish (4.74),
HoraInicio(0600);
variables:
NP( 0 ),
OPP( 0 ),
Todaynet( 0 ),
Yesterdaynet(0),
ProfToday( 0 ),
Trades_Today(0),
StartingTrades(0),
MP(0),
tradeON(false);
NP = I_closedequity ;
if date <> date[1] then begin
Yesterdaynet = I_closedequity ;
end;
ProfToday = (NP - Yesterdaynet);
Plot1(ProfToday,"Profit");
Plot2(0,"Cero");
pLOT3(Daily_ProfitTarget,"pROFIT");
plot4(-Daily_LossTarget,"Loss");
Setplotcolor(2,yellow);
if Use_Daily_Profit_0_1 = 1 and ProfToday >= Daily_ProfitTarget or ProfToday <= -absvalue(Daily_LossTarget) then
begin { exit all trades }
Setplotcolor(1,Red);
End;
[/CODE]
|


