|
Chicago, IL
Legendary Price Action Student
Experience: Beginner
Platform: Sierra Chart
Broker: Edge Clear
Trading: MES
Posts: 2,172 since Feb 2019
Thanks Given: 9,626
Thanks Received: 9,635
|
Hello,
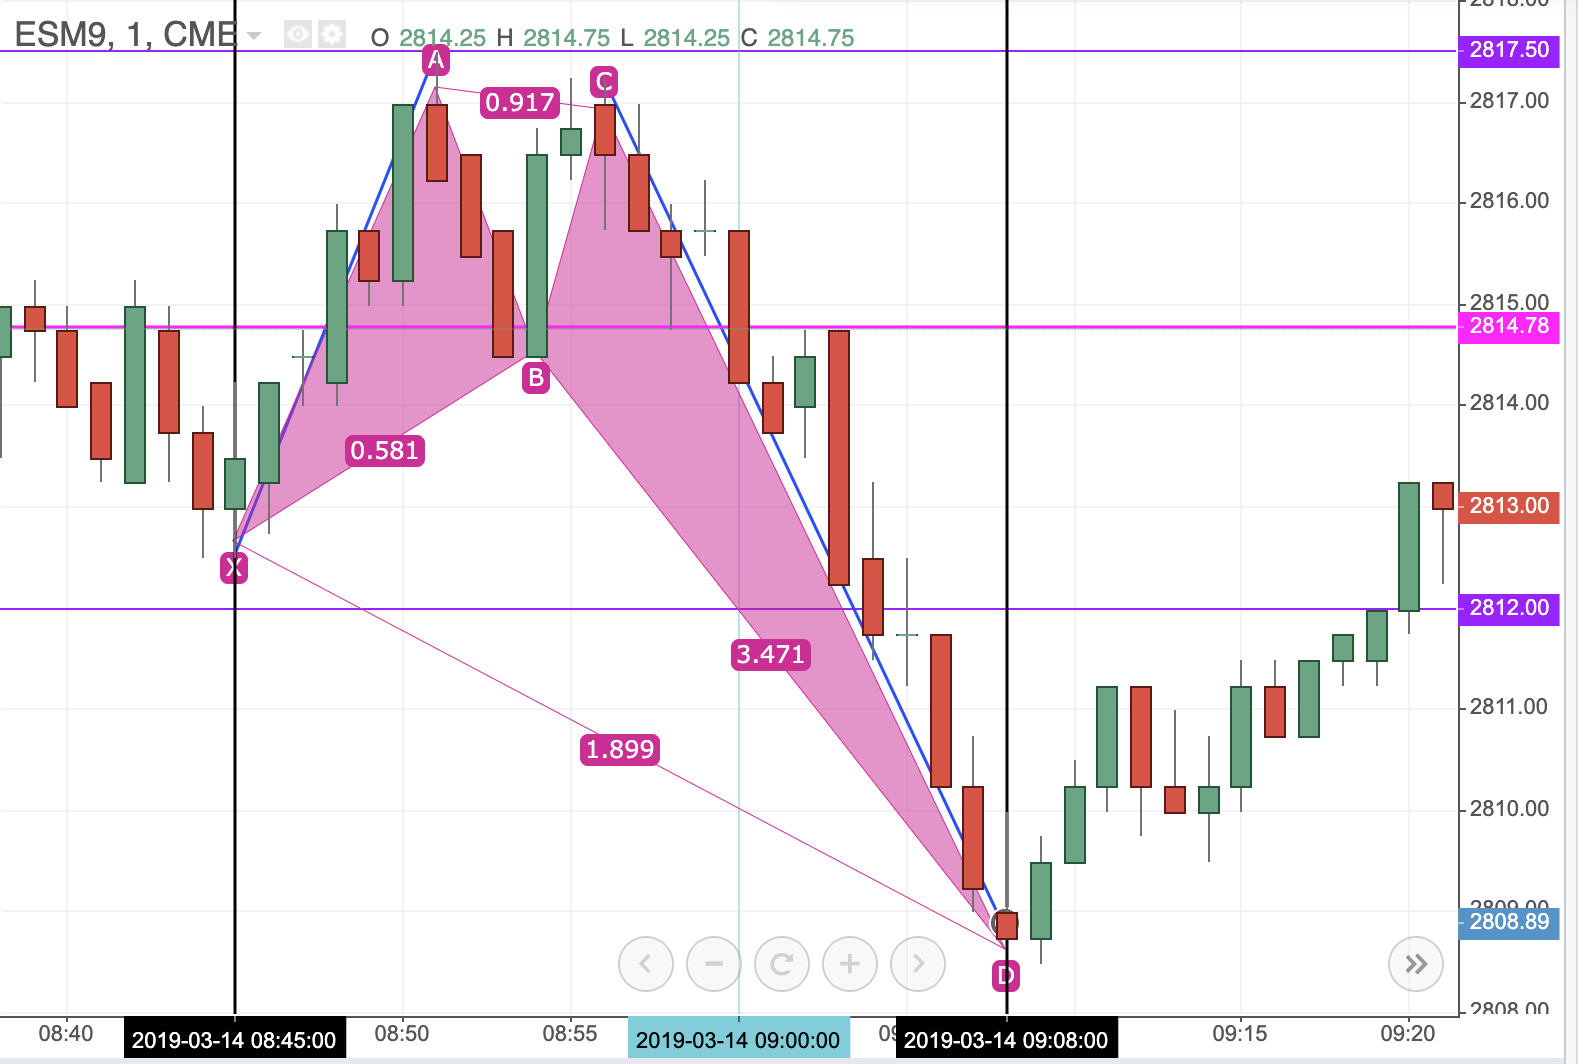
I've been investigating periods of perceived "choppy" market-behavior to try and get better at identifying trading opportunites in them. Right now choppy markets seem frantic and my hope is that by studying these conditions, I will be able to see the market "slow down" a bit for me, so I can see through the chop!
I noticed this "choppy" moment coincided with a widening of range, and seemed to fit this "xabcd" pattern, but I don't really understand the fibonacci time element. I tried to research this, but a lot of sites give vague descriptions as if they don't seem to really understand it either.
So would this be considered a true "xabcd" pattern and why/why-not? How does the fibonacci-time element fit/not-fit?
Here are fibonacci retracements involved:
100% : 2826.50 YH
76.4% : 2817.50
61.8% : 2812.00
50.0% : 2807.50
38.2% : 2802.75
23.6% : 2797.25
0% : 2788.25 YL
And the midpoint is in Pink.
(this is from just after the opening bell first-rate opening range chop-action in this morning's /ES market! 1-min. ticks are used.
Regards,
snax
|


