Welcome to NexusFi: the best trading community on the planet, with over 150,000 members Sign Up Now for Free
Genuine reviews from real traders, not fake reviews from stealth vendors
Quality education from leading professional traders
We are a friendly, helpful, and positive community
We do not tolerate rude behavior, trolling, or vendors advertising in posts
We are here to help, just let us know what you need
You'll need to register in order to view the content of the threads and start contributing to our community. It's free for basic access, or support us by becoming an Elite Member -- see if you qualify for a discount below.
-- Big Mike, Site Administrator
(If you already have an account, login at the top of the page)
Searching for a PVP (Peak of Volume at Price) indicator for Multichart
as in the title I'm searching for a PVP (Peak of Volume at Price) indicator for Multichart. I really browsed a lot of links but I cannot find anything. So strange but surprisingly I cannot find anything around. Do you have any suggestion or link to provide?
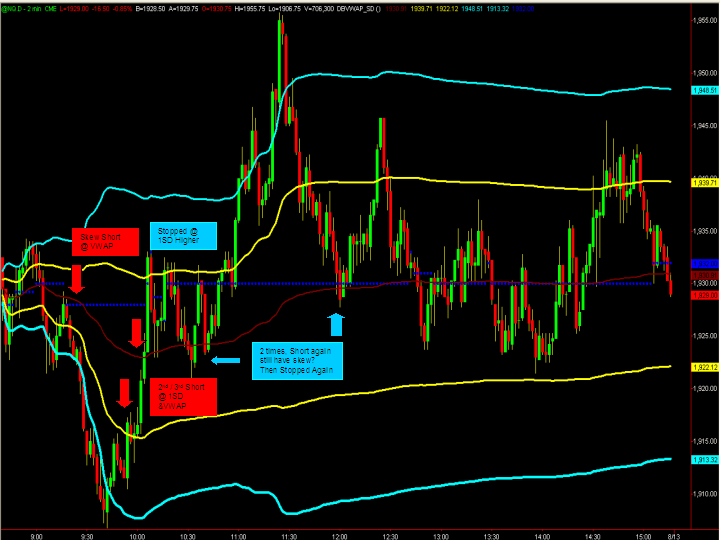
I'm looking for something like this that plot the PVP in real time during the day as a simple line. As you can see it's easier and natural that it changes a lot in the first hours of the market where volumes are low and it gets stable as the session proceeed.
example found on the web (PVP is the blue dotted line):
thanks for your answer. So it should be the oDevelopingVolPOC from your ValueArealPlots function if I'm correct.
I was succesfully able to use your indicator (and I'm using it over a 5 min bar chart very often ) but I'm trying to apply it now over the EuroSTOXX 50 future with a 1000 contract bar chart... and it always give me and " Array Bounds.Wron Index value: -250". It happened in the past and I solved typing 1500 for the array.. but now it is not working... even putting 10000 ...
I was simply trying to plot the oDevelopingVolPOC to see it is what I'm looking for, is there any limit for the function over "contract" based chart?
this can be caused by two things. Either the chart you are applying the indicator spans over more price ticks from the high to the low than what you allowed with the array size - in which case the array size needs to be higher.
The other cause could be wrong symbol settings in Quotemanager for that symbol resulting in wrong tick values which in turn might require too large arrays - in this case correcting the symbol settings would be the way to go.
It is a good practice in Multicharts to check the symbol settings after adding new symbols into Quotemanager, as they are not necessarily correct by default.
as always thank you for you fast reply. I didn't set up the symbol mapping on the eurostoxx simply because it was almost the first time I' was studying it!
Now I changed the symbol mapping with the correct values and the indicator is working fine with not error.
I applied it over a 1000 contract bar chart over the EUSTOSTOXX 50, is that ok to use it to plot the oDevelopingVolPOC with this bar configuration? (I'm just asking bacause I remember you said that to calculate the price value area it was the best to apply the indicator over a 1 or 2 minute bar chart, but I think that with volume things are different and I just want to be sure to trust the oDevelopingVolPOC even on 1000 contract bar chart).
Multicharts doesn't provide access to the volume at each price in PowerLanguage. Therefore the code splits the bar volume across the bar range evenly. Having said this the results are therefore more accurate the smaller the bar ranges are and that's why I would suggest using 1 minute bars. Using contract bars can work, too, but I would also make sure to use increments that don't create too wide bars as this might impact the accuracy.