Published: June 20, 2017
In this article, we�ll break down the various components of
Order Flow, so that you can gain a �ground up� understanding of order flow analysis and its relevance in trading.
Order flow analysis studies the factors that both cause and prevent price movement. To help you understand these processes in play, we�ll break it down without using trading jargon.
At the end of the article, you�ll have a working, practical knowledge of order flow that you can start to use to in your trading.
Contents
|

|
|
|
Many people in the trading world describe the markets as an �auction�. You hear terms like �the market is auctioning up� � but what does that mean? Why not just say �the market is moving up�? If you take a new trader and tell him for the first time �the market is an auction�, will that trader then turn around and say �aaaaah � now I understand perfectly�? Probably not.
Per the dictionary, an auction is:
�a publicly held sale at which property or goods are sold to the highest bidder�
That definition does not fit the financial markets. In traditional auctions, people are bidding against each other for an item. Price only goes one way (up) once bidding commences. There are also
reverse auctions or �Dutch auctions� where competitors
bid lower prices to win business.
In both cases, we have 2 �sides� and price moving one way (once a first bid has been accepted). In addition, the participants are on one side or the other. If you take an item to sell, you don�t end up buying it.
The term �auction� does not seem to fit what is going on in financial markets. For now, let�s put the term to one side, so that we don�t get confused between �real life� auctions and what�s happening in the markets.
Don�t get me wrong, I�m not knocking the details of �Auction Market Theory� (ala James Dalton). It�s a good way to look at the market. Just that the term �auction� is overused and not very helpful. Neither is claiming the market is �auctioning up�. It�s simply a smart sounding buzzphrase for �moving up� which provides no additional clarity or actionable information.
Let�s put the auction model to one side and discuss the forces that impact price and how they interact. Something that has practical use.
[hide][top]4 Forces � A Practical Model
Financial markets are �4 way markets�. In other words, there are 4 �forces� at play in the markets that impact overall direction. These forces are:
- Buy Limit Orders (Bids) � Weak up force
- Sell Limit Orders (Offers/Asks) � Weak down force
- Buy Market Orders (Buys) � Strong up force
- Sell Market Orders (Sells) � Strong down force
The first question that comes to mind is �Where are the
stop orders?�. Stop orders are important but they aren�t an individual force. That�s because stop orders are simply market orders that get created when something happens. A
stop order is simply an instruction to create a
market order.
Unlike a regular auction, speculators will switch from being one force to another. To get into and out of the market you first buy and then sell (or vice-versa). You are participating as 2 different forces at 2 different times. Over the duration of a day, it�s quite common to participate as all 4 forces throughout your various trades.
We have 4 forces but only 2 possible interactions. Just 2 ways the 4 forces can work together:
- Interaction Up - Buy Market Orders & Sell Limit Orders (a buy)
- Interaction Down - Sell Market Orders & Buy Limit Orders (a sell)
If all interactions have a buy on one side and a sell on the other, then that would seem a neutral event. If these interactions were neutral, then price wouldn�t move. They aren�t neutral because we have strong forces reacting with weak forces. That�s where liquidity consumption comes in�
The term �liquidity� is one that confuses a lot of traders, let�s explain before we continue. Liquidity refers to the availability of the �other side� to trade with. A liquid market is one that�s easy to get into and out of as there�s always someone on the other side to trade with when you want to enter or exit.
If we consider the 2 possible above, it�s the limit orders, the �weak forces� that are considered the other side. Limit orders are the liquidity. It�s as simple as that. In every trade you take, you will either be providing liquidity (limit orders) or consuming liquidity (market orders). It�s that process of consumption that is key to price movement.
 | In the image to the left (figure 1), we have a the strong up force, (market buyer, green), consuming the weak down force (sell limit orders, red dots). The market buyer will consume all liquidity at one price before he can move up and consume the liquidity at the next price up.
You�ll notice there�s no liquidity beneath him. That�s because he�s eaten it. That�s why on the sell side � liquidity only exists above us. |
| Figure 1 | |
 | If we look at the other interaction (figure 2) � strong down force consuming weak up force (sell market orders consuming buy limit orders), we have the opposite occurring. |
| Figure 2 | |
Sell market orders consume buy limit orders. When the buy limit orders have been consumed at a level, price moves down and we eat the limit orders at the next price down. There are no buy limit orders above us as they have already been eaten. We wouldn�t be at these prices if we hadn�t eaten all the buy limit orders above us.
[hide][top]Moving Force & Stopping Force
We have strong and weak forces. We can also consider them moving and stopping forces.
Movement in the markets comes from market orders. Like our Pac-Man, they move through the limit orders, consuming as they go. If there�s no market orders, there�s no movement.
Limit orders might not create movement but they can stop it. Sometimes, there�s just too much liquidity to eat. Often the limit orders are �hidden� and more are added as the market orders attempt to eat them. That�s known as an
iceberg order.
When sell market orders can no longer �eat� the buy side liquidity at a level, price stops moving down. Not only that, many of those that sold with market orders are now stuck, having shorted contracts only to find price is no longer moving their way.
Balance of trade (volume of buy market orders vs sell market orders) is important in order flow. It�s not enough to analyze just the strong/moving forces. Stopping force events are more nuanced but equally as important. In the above image, the buy limit orders became a stronger stopping force.
Sometimes the stopping force is evident on the Depth of Market (DOM) but much of the time it�s hidden and you only get to see how much liquidity is truly there by how much �eating� occurs. | 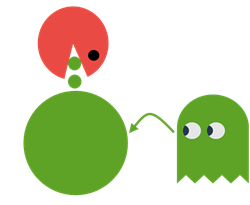 |
| Figure 3 |
We have seen there are 2 strong/moving forces, on up and one down. They are totally independent. There is still a missing piece but before we cover that, let�s consider how the 2 interactions work together.
We have bids and offers that get eaten by sell and buy market orders. The limit orders are a stopping force. Most of the time that force is weak but sometimes it�s strong enough to stop price from moving. The terms �inside bid� and �Inside offer� simply refer to the bid and offer prices that have to be eaten next. The highest bid and the lowest offer. | 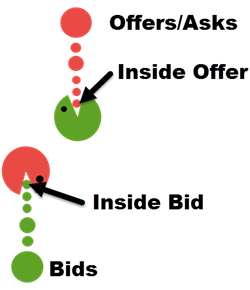 |
| Figure 4 |
 | So what is the missing piece? Well, if the above image is a true representation of what happens in the market � why don�t we see the distance between the bids and offers increase as trade continues? Why don�t we see this (figure 5).
Think about it. What we have discussed so far is 2 interactions with no relationship between them. We take for granted that the bids and offers tend to move up and down together. Yet they are not related at all. The interaction up is completely independent of our interaction down. So why do we not see the up and down forces moving the 2 sides of the market further and further apart? |
| Figure 5 | |
If the spread gets wider, it creates an opportunity for people to play the spread. With a 20-tick spread, you could (for example) offer 55.50 and bid 55.30. You�d stand to get a 20-tick profit if your orders get filled. That�s where �The Deplorables� come in�
 | With a 20-tick spread, you stand to make a 20-tick profit. But what if someone is willing to jump in front of you and take an 18-tick profit? All they�d have to do is put in a 1-tick higher bid and a 1-tick lower offer. Now the spread is 18 ticks.
During the days of the trading floors, this �jumping in front� was known as �diming� the market. If the spread was 2-ticks, someone could dime the market and jump to the front on one side, narrowing the spread to 1-tick. In some markets, doing this repeatedly would see you downstairs past the �no fighting� line outside the CME building, being forcefully re-educated in the face by a fellow trader (before make-up drinks as Ceres). How they must miss the �good old days�.
In most electronic markets, the spread will rarely widen for long before somebody jumps in the gap. Whoever jumps in just got first place in the queue and will be filled against the next market order that comes along. |
| Figure 6 | |
What is the effect of the spread narrowing? Let�s say the inside bid is 55.50 and the inside offer 55.55. We know that the next market sell order will eat at the remaining bids at 55.50. Someone comes in and narrows the spread with a bid of 55.51. Market orders now have to eat the bids at 55.51, one price higher. The offer side didn�t move but the bid side moved up 1 tick, closing the gap. The bids can continue to rise until they reach the lowest offer. That is as high as the bids can go. Diming can move the markets together but cannot move them apart. It�s like a magnet between the bids and offers.
The upshot is, that while we do have 2 independent interactions � one up and one down, this filling of the spread is the �glue� that stops these 2 interactions occurring further & further apart.
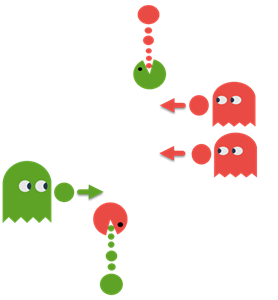
We have an �up� interaction and a �down� interaction. We have �the deplorables� filling in any gap between them, gluing them together and making it a tug of war.
But it�s a tug of war where there�s also a stopping force that could
pop up at any moment. In this case, we can see a tug of war between buy market orders and sell market orders. A few ticks up we see a large sell
limit order.
If that is real (in other words, they don�t pull out of the way when we get there), it might be too much for the buy market orders to consume. They might not be able to eat through all that liquidity.
Balance of trade is a part of the picture. All other things being equal, the side with the most market orders will see the market move their way. A lot of the time, that�s all we see going on. We may see the majority side being buy market orders for hours and the market moving up. Later on, we�ll see the balance change to sell side and the market then moves down. Ebb and flow.
Other times the stopping force will be in effect. It may be visible (bids/offers displayed) or invisible (iceberg order). It may be fake � in which case it disappears when price approaches.
The stopping force will ALWAYS be evident in the number of contracts traded at each price. For example, it may take and average of 300 contracts to eat through each price on the way up but then suddenly it�s taking 500, then 900, then 2000. That�s the stopping force getting stronger. |  |
| Figure 7 |
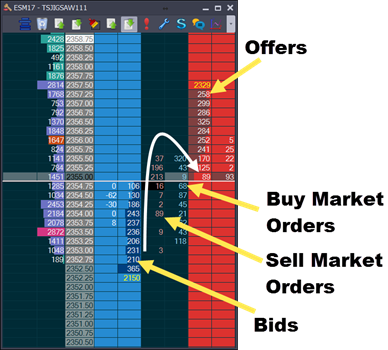 | So how does this appear outside of an 80�s arcade game? Here�s a snapshot of the DOM (from Jigsaw Depth & Sales) at the time of writing.
We can see the 4 forces interacting. The weak/stopping force of the bids and offers and the strong moving force of the market orders.
We can see that the bids and offers are around the same size but smaller the closer we are to the inside. That�s quite normal.
Price had moved up to 55.50 and then rolled over back down to 54.75. (Note that the market order numbers there are not cumulative). On the way up, we can see more buy market orders than sell market orders, as we�d expect. We can also see 21, 45, 87, 68 contracts traded to successively move up through each level. Then at 55.50, we see 320 contracts trad and there were no more moves up.
This is the stopping force in action. The buy market orders continued but the offers stayed firm and absorbed the buying. Now we see the market moving down. This highlights why you need to keep an eye on all four forces and not just the balance of trade. |
| Figure 9 | |
This is the same activity but a visual/historical perspective (from Jigsaw Auction Vista).
The horizontal blue and red areas are the bids and offers (with lighter colors being stronger areas).
We can see that there aren�t any significant areas of liquidity around the prices we traded (yellow lines).
What we can see at the top of the move is the blue/red circle. It shows that an abnormally large amount of trade for the time of day occurred there. It was mostly buying and price didn�t move up from that point. The weak force isn�t showing their hand, they are adding more limit orders as the buyers continue buying. The limit orders are effectively hiding.
There are many different order flow tools. Each shows a different perspective of the same information. | 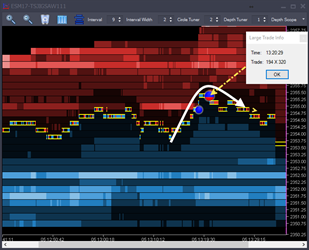 |
| Figure 10 |
Understanding the mechanics of price movement is the first step towards benefiting from order flow. The next step isn�t necessarily �more theory�, although we will follow up with another article that goes into more detail about the various ways you can utilize this information.
There is no substitute for practical experience and for that, I recommend you take a look at the
Trading Drills that are part of Jigsaws �
Order Flow Foundation Course�, a free course with over 15 hours of video instruction
covering all aspects of order flow analysis.
Peter Davies
Jigsaw Trading -
https://www.jigsawtrading.com/