NexusFi: Find Your Edge


Home Menu


SMA on differnt time chart


Discussion in NinjaTrader

Updated
      Top Posters
    1. looks_one Quick Summary with 1 posts (0 thanks)
    2. looks_two choke35 with 1 posts (1 thanks)
    3. looks_3 Fat Tails with 1 posts (5 thanks)
    4. looks_4 liorzuk with 1 posts (0 thanks)
    1. trending_up 1,649 views
    2. thumb_up 6 thanks given
    3. group 3 followers
    1. forum 3 posts
    2. attach_file 3 attachments


Search this Thread

SMA on differnt time chart

  #1 (permalink)
 liorzuk 
Israel
 
Experience: Beginner
Platform: NinjaTrader
Trading: es
Posts: 72 since May 2013
Thanks Given: 43
Thanks Received: 20

Hello
I want to ask if i there is a way to add a SMA 200 (for example) of 1 day chart on a 60 min chart

Started this thread Reply With Quote

Can you help answer these questions
from other members on NexusFi?
About a successful futures trader who didnt know anythin …
Psychology and Money Management
Better Renko Gaps
The Elite Circle
REcommedations for programming help
Sierra Chart
NT7 Indicator Script Troubleshooting - Camarilla Pivots
NinjaTrader
ZombieSqueeze
Platforms and Indicators
 
  #3 (permalink)
 choke35 
Germany
 
Experience: Intermediate
Platform: Other
Trading: ES, YM, 6E
Posts: 2,668 since Feb 2013
Thanks Given: 5,101
Thanks Received: 6,558


liorzuk View Post
Hello
I want to ask if i there is a way to add a SMA 200 (for example) of 1 day chart on a 60 min chart

0. File - New Chart
1. Add your 60min data series to the chart (shown as Panel 1)
2. Add the second data series for the same instrument (days to load for 2. must be >200 in order to print SMA-200 values later); shown as Panel 2
3. Add the SMA indicator to the chart
4. Modify SMA indicator properties to: Period: 200; Input: [your instrument] DAILY; Panel: 1
5. Switch COBC to false if you want the current 60min periods to show with SMA (COBC = true will end yesterday)

The result should e.g. look like the attachment for the YM.

P.S.: More sophisticated solutions need Ninjascript/C# coding ...

Attached Thumbnails
Click image for larger version

Name:	YM 03-15 (60 Min) _ YM 03-15 (Daily)  02_01_2015.jpg
Views:	165
Size:	149.2 KB
ID:	170435  
Reply With Quote
Thanked by:
  #4 (permalink)
 
Fat Tails's Avatar
 Fat Tails 
Berlin, Europe
Market Wizard
 
Experience: Advanced
Platform: NinjaTrader, MultiCharts
Broker: Interactive Brokers
Trading: Keyboard
Posts: 9,888 since Mar 2010
Thanks Given: 4,242
Thanks Received: 27,103

Easiest way:

Make sure that you use a proper session template with a single session per day.

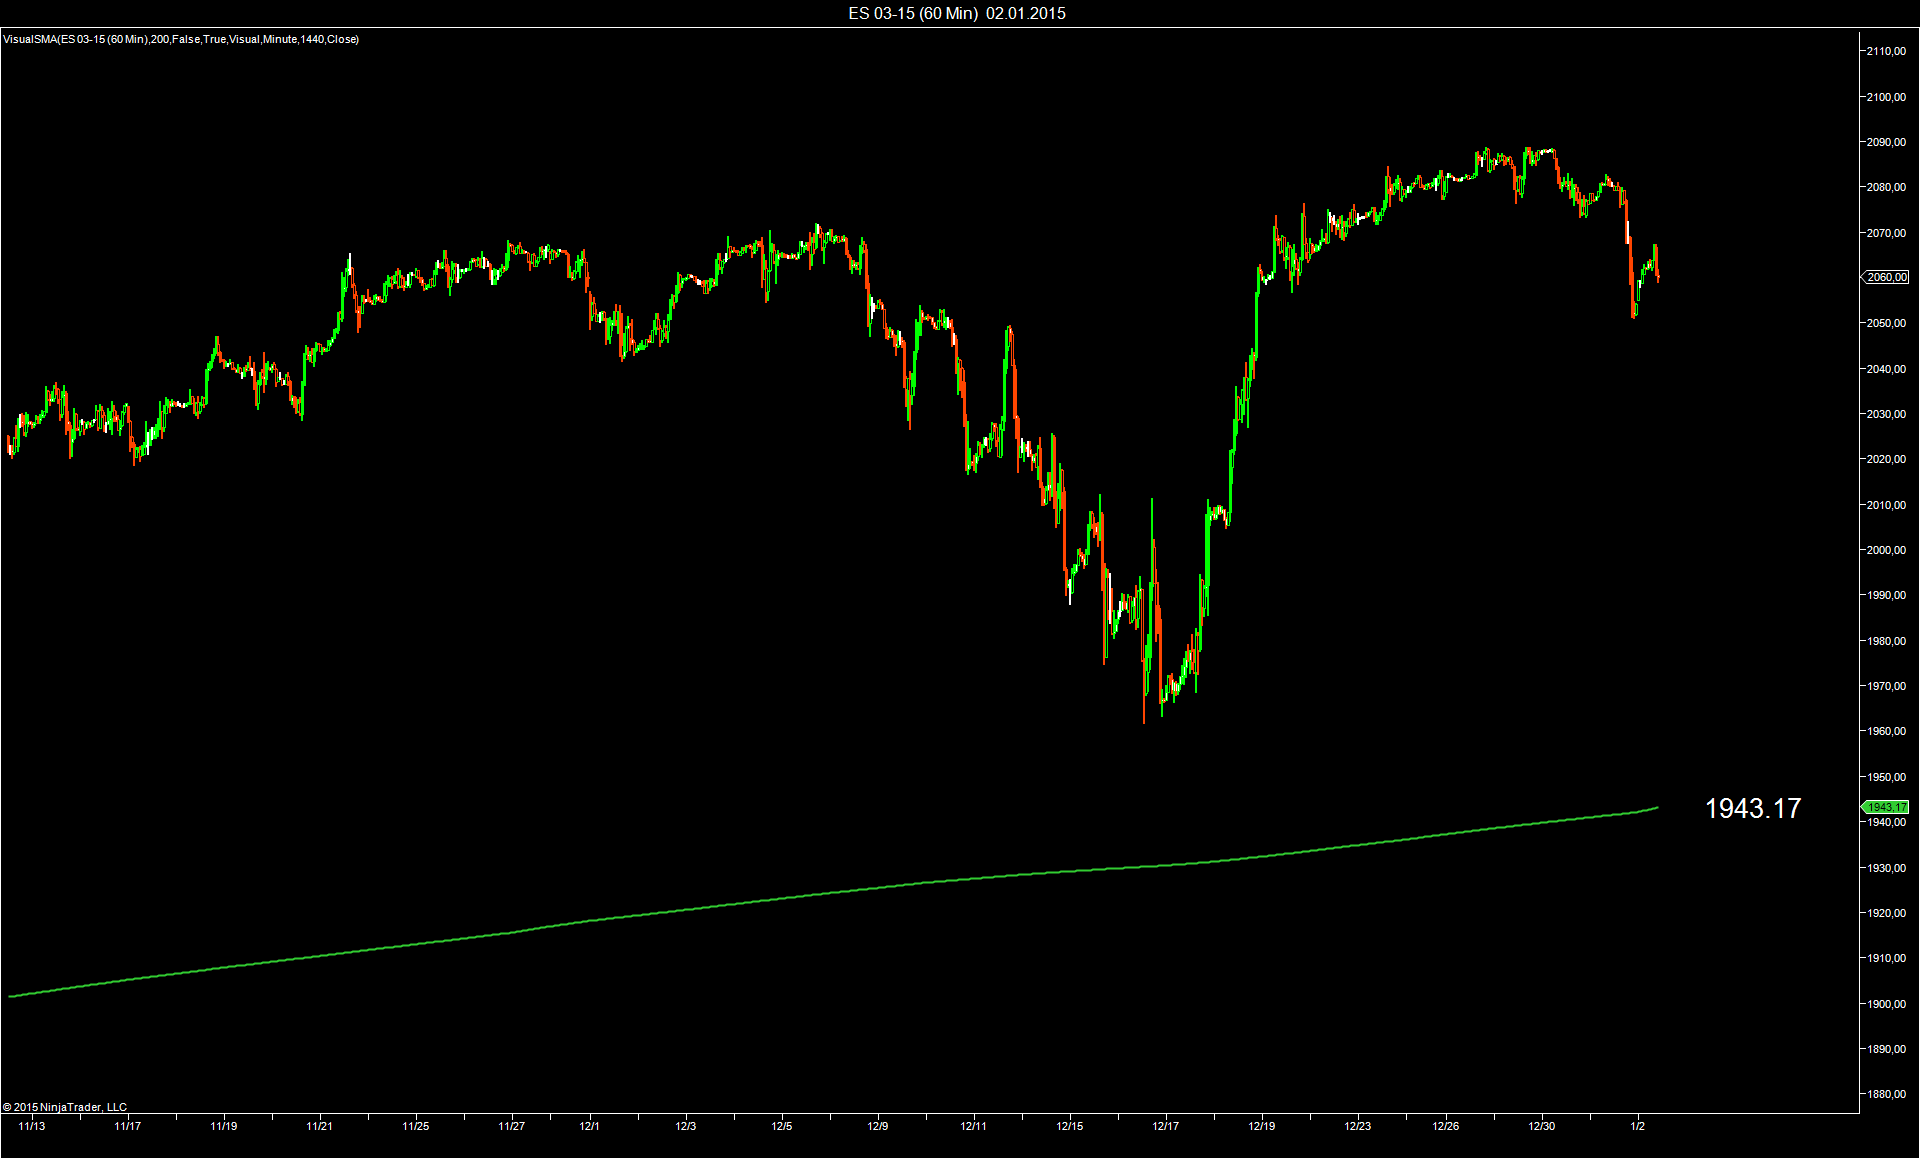
Then add the VisualSMA, set the "Bar Period" to 1440 and the "Period" to 200.


VisualSMA plotting a daily SMA(200): The SMA is calculated from the closing price (full session) of the last 200 business days for which the exchange was open.


SMA(200) applied to a daily chart: The SMA is calculated from the settlement prices (depends on the datafeed) of the last 200 business days for which a settlement price has been determined.
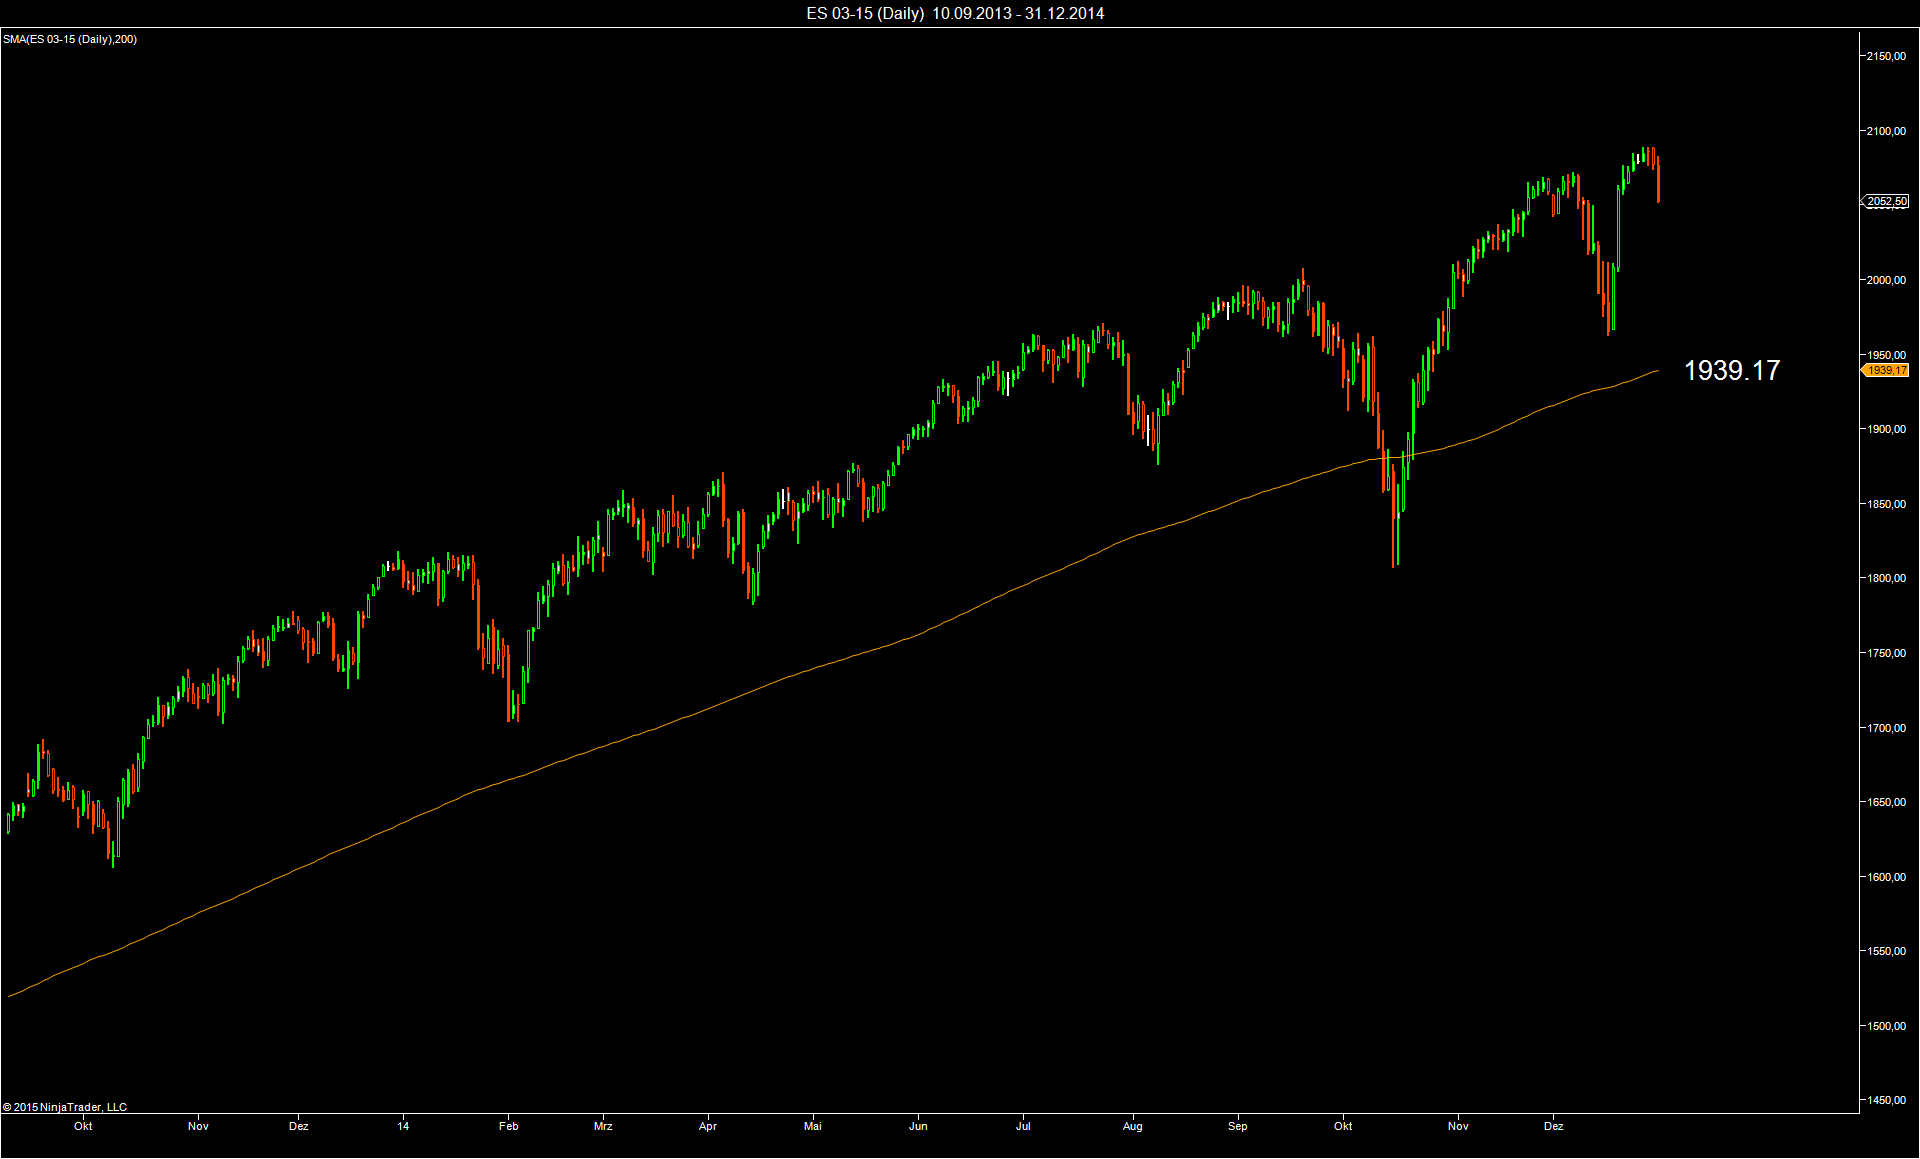


The difference between the two values can be explained as follows:

The VisualSMA(200) uses the last traded price and not the settlement price

The daily SMA(200) does not use the values from Independence Day, Labor Day and Thanksgiving (no settlement price available) and therefore takes an additional three days from June to finish with 200 values.

This explains that the value comes out a few points lower.

Reply With Quote


Last Updated on January 2, 2015


© 2024 NexusFi™, s.a., All Rights Reserved.
Av Ricardo J. Alfaro, Century Tower, Panama City, Panama, Ph: +507 833-9432 (Panama and Intl), +1 888-312-3001 (USA and Canada)
All information is for educational use only and is not investment advice. There is a substantial risk of loss in trading commodity futures, stocks, options and foreign exchange products. Past performance is not indicative of future results.
About Us - Contact Us - Site Rules, Acceptable Use, and Terms and Conditions - Privacy Policy - Downloads - Top
no new posts