NexusFi: Find Your Edge


Home Menu


Creating a Coupling/Decoupling Chart - Help Needed!


Discussion in NinjaTrader

Updated
    1. trending_up 1,508 views
    2. thumb_up 2 thanks given
    3. group 3 followers
    1. forum 6 posts
    2. attach_file 0 attachments


Search this Thread

Creating a Coupling/Decoupling Chart - Help Needed!

  #1 (permalink)
 JustinIsHere 
Montreal, Canada
 
Experience: Beginner
Platform: NinjaTrader, Multicharts
Trading: ES
Frequency: Never
Duration: Never
Posts: 113 since Dec 2011
Thanks Given: 57
Thanks Received: 128

So far, I've come up with this result:


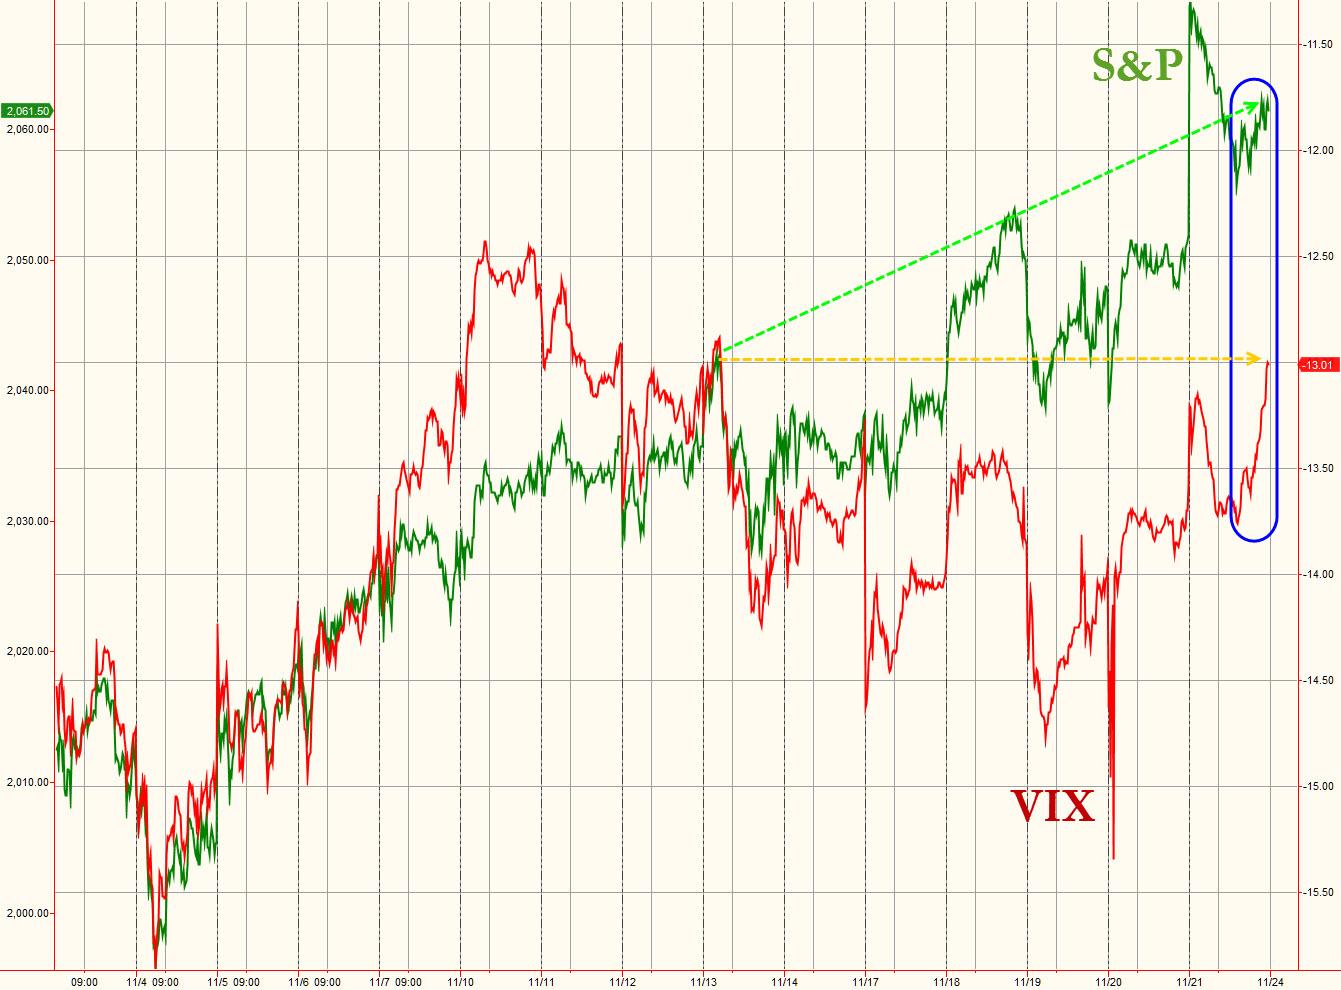
I would like to invert the price on one of either instrument in order to create a correlation, since ZB and ES are usually inversely correlated.
Similar to how it's done in this picture below (The VIX price goes up as you go down the chart):


Anyone could help me out in setting it up?

Also, does anyone know how to set it so that each vertical line = 1 day, it's currently 7 days for each vertical line.

Started this thread Reply With Quote

Can you help answer these questions
from other members on NexusFi?
Better Renko Gaps
The Elite Circle
Pivot Indicator like the old SwingTemp by Big Mike
NinjaTrader
Trade idea based off three indicators.
Traders Hideout
Exit Strategy
NinjaTrader
NT7 Indicator Script Troubleshooting - Camarilla Pivots
NinjaTrader
 
Best Threads (Most Thanked)
in the last 7 days on NexusFi
Diary of a simple price action trader
26 thanks
Just another trading journal: PA, Wyckoff & Trends
24 thanks
Tao te Trade: way of the WLD
22 thanks
My NQ Trading Journal
16 thanks
HumbleTraders next chapter
9 thanks
  #2 (permalink)
 
Zxeses's Avatar
 Zxeses 
San Francisco CA
 
Experience: Intermediate
Platform: Ninja
Broker: CQG
Trading: ES
Posts: 139 since Jun 2014
Thanks Given: 90
Thanks Received: 172

Create a new indicator with 1 plot of an SMA(1) where each value is multiplied by -1.

Something like this:

double val = SMA(1)[0] * -1;
MyPlot1.Set(val);

If you keep the indicator left aligned like your data plot, set the data plot to Overlay and Transparent, you wouldnt need the extra code to create a Dataseries. Might be a good easy one for a new coder to cut your teeth on.

Visit my NexusFi Trade Journal Reply With Quote
Thanked by:
  #3 (permalink)
 JustinIsHere 
Montreal, Canada
 
Experience: Beginner
Platform: NinjaTrader, Multicharts
Trading: ES
Frequency: Never
Duration: Never
Posts: 113 since Dec 2011
Thanks Given: 57
Thanks Received: 128


Ok, never fiddled with the Ninjatrader Indicator wizard, so this is my first dib at it. I'm getting an error in the code and I'm not quite sure what's going. LOL. I just pasted what you wrote, inside a document I created with the wizard, with most settings on default and kept hitting next (I was thinking I could edit out what's not needed).

I thought this whole idea could be easily done by tweaking some settings in Ninjatrader


Code
#region Using declarations
using System;
using System.ComponentModel;
using System.Diagnostics;
using System.Drawing;
using System.Drawing.Drawing2D;
using System.Xml.Serialization;
using NinjaTrader.Cbi;
using NinjaTrader.Data;
using NinjaTrader.Gui.Chart;
#endregion

// This namespace holds all indicators and is required. Do not change it.
namespace NinjaTrader.Indicator
{
    /// <summary>
    /// Indicator used to invert an instrument's price in order to create a coupling/decoupling chart.
    /// </summary>
    [Description("Indicator used to invert an instrument's price in order to create a coupling/decoupling chart.")]
    public class CouplingDecoupling : Indicator
    {
        #region Variables
        // Wizard generated variables
            private int myInput0 = 1; // Default setting for MyInput0
        // User defined variables (add any user defined variables below)
        #endregion

        /// <summary>
        /// This method is used to configure the indicator and is called once before any bar data is loaded.
        /// </summary>
        protected override void Initialize()
		double val = SMA(1)[0] * -1;
		MyPlot1.Set(val);

        /// <summary>
        /// Called on each bar update event (incoming tick)
        /// </summary>
        protected override void OnBarUpdate()
        {
            // Use this method for calculating your indicator values. Assign a value to each
            // plot below by replacing 'Close[0]' with your own formula.
            Plot0.Set(Close[0]);
        }

        #region Properties
        [Browsable(false)]	// this line prevents the data series from being displayed in the indicator properties dialog, do not remove
        [XmlIgnore()]		// this line ensures that the indicator can be saved/recovered as part of a chart template, do not remove
        public DataSeries Plot0
        {
            get { return Values[0]; }
        }

        [Description("")]
        [GridCategory("Parameters")]
        public int MyInput0
        {
            get { return myInput0; }
            set { myInput0 = Math.Max(1, value); }
        }
        #endregion
    }
}

Started this thread Reply With Quote
  #4 (permalink)
 JustinIsHere 
Montreal, Canada
 
Experience: Beginner
Platform: NinjaTrader, Multicharts
Trading: ES
Frequency: Never
Duration: Never
Posts: 113 since Dec 2011
Thanks Given: 57
Thanks Received: 128

I took a look at this post ( Plotting inverse of ZN price - [AUTOLINK]NinjaTrader[/AUTOLINK] Support Forum) and I'm not sure how to apply it to build an indicator. Could anyone provide some inputs as how to format it?

Started this thread Reply With Quote
  #5 (permalink)
 
cory's Avatar
 cory 
virginia
 
Experience: Intermediate
Platform: ninja
Trading: NQ
Posts: 6,098 since Jun 2009
Thanks Given: 877
Thanks Received: 8,090


JustinIsHere View Post
I took a look at this post ( Plotting inverse of ZN price - [AUTOLINK]NinjaTrader[/AUTOLINK] Support Forum) and I'm not sure how to apply it to build an indicator. Could anyone provide some inputs as how to format it?

try this

Reply With Quote
Thanked by:
  #6 (permalink)
 JustinIsHere 
Montreal, Canada
 
Experience: Beginner
Platform: NinjaTrader, Multicharts
Trading: ES
Frequency: Never
Duration: Never
Posts: 113 since Dec 2011
Thanks Given: 57
Thanks Received: 128


cory View Post
try this

Thanks cory, although I wasn't able to find how to plot another instrument on the same using "Line on close" Chart style.

However, I found this ( Links and Downloads Manager - [AUTOLINK]NinjaTrader[/AUTOLINK] Support Forum) to work.

Here's what it looks like:


Settings Used:


Started this thread Reply With Quote
  #7 (permalink)
 JustinIsHere 
Montreal, Canada
 
Experience: Beginner
Platform: NinjaTrader, Multicharts
Trading: ES
Frequency: Never
Duration: Never
Posts: 113 since Dec 2011
Thanks Given: 57
Thanks Received: 128

Now if there was a way to have a divergence indicator that could give me a number so that I could tell for sure that there is a divergence forming...
Like something that could calculate the distance between the two prices.

Started this thread Reply With Quote


Last Updated on November 22, 2014


© 2024 NexusFi™, s.a., All Rights Reserved.
Av Ricardo J. Alfaro, Century Tower, Panama City, Panama, Ph: +507 833-9432 (Panama and Intl), +1 888-312-3001 (USA and Canada)
All information is for educational use only and is not investment advice. There is a substantial risk of loss in trading commodity futures, stocks, options and foreign exchange products. Past performance is not indicative of future results.
About Us - Contact Us - Site Rules, Acceptable Use, and Terms and Conditions - Privacy Policy - Downloads - Top
no new posts