|
Berlin, Europe
Market Wizard
Experience: Advanced
Platform: NinjaTrader, MultiCharts
Broker: Interactive Brokers
Trading: Keyboard
Posts: 9,888 since Mar 2010
Thanks Given: 4,242
Thanks Received: 27,102
|
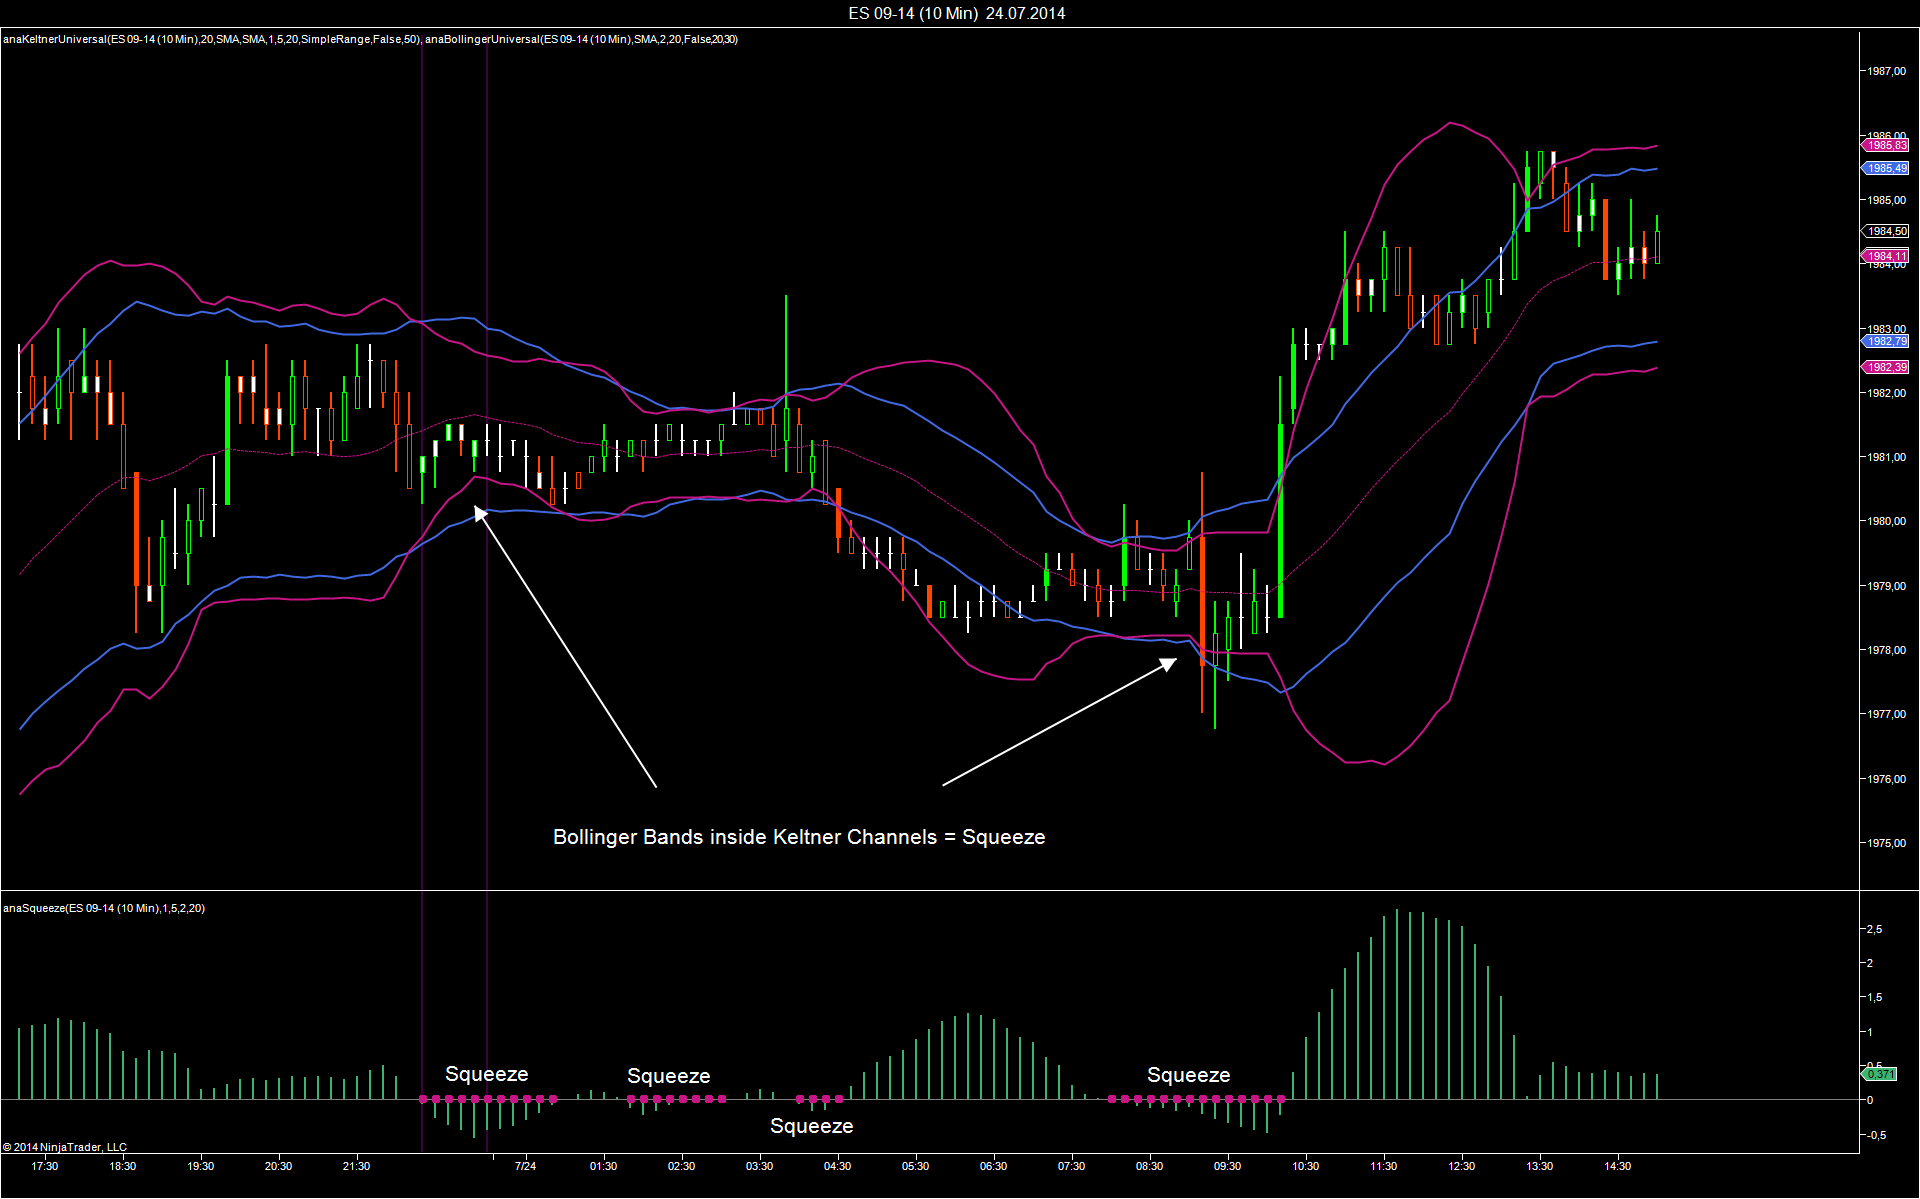
Technically, the Bollinger Band squeeze refers to a condition when the Bollinger Bands are running inside a Keltner Channel.
-> Bollinger Bands are constructed by adding/subtracting a multiple of the standard deviation to/from the midband
-> Keltner Channels are constructed by adding/subtracting a multiple of the average range to/from the midband
Detecting rangebound price action
The standard deviation takes into account the momentum over the lookback period, while the average range just takes into account the bar size. The squeeze is calculated as
2 * standard deviation calculated from the last 20 closes < 1.5 * average range (bar size) of the last 20 bars
The meaning is that momentum is comparatively small to intra-bar volatility. The indicator indentifies range bound price action.
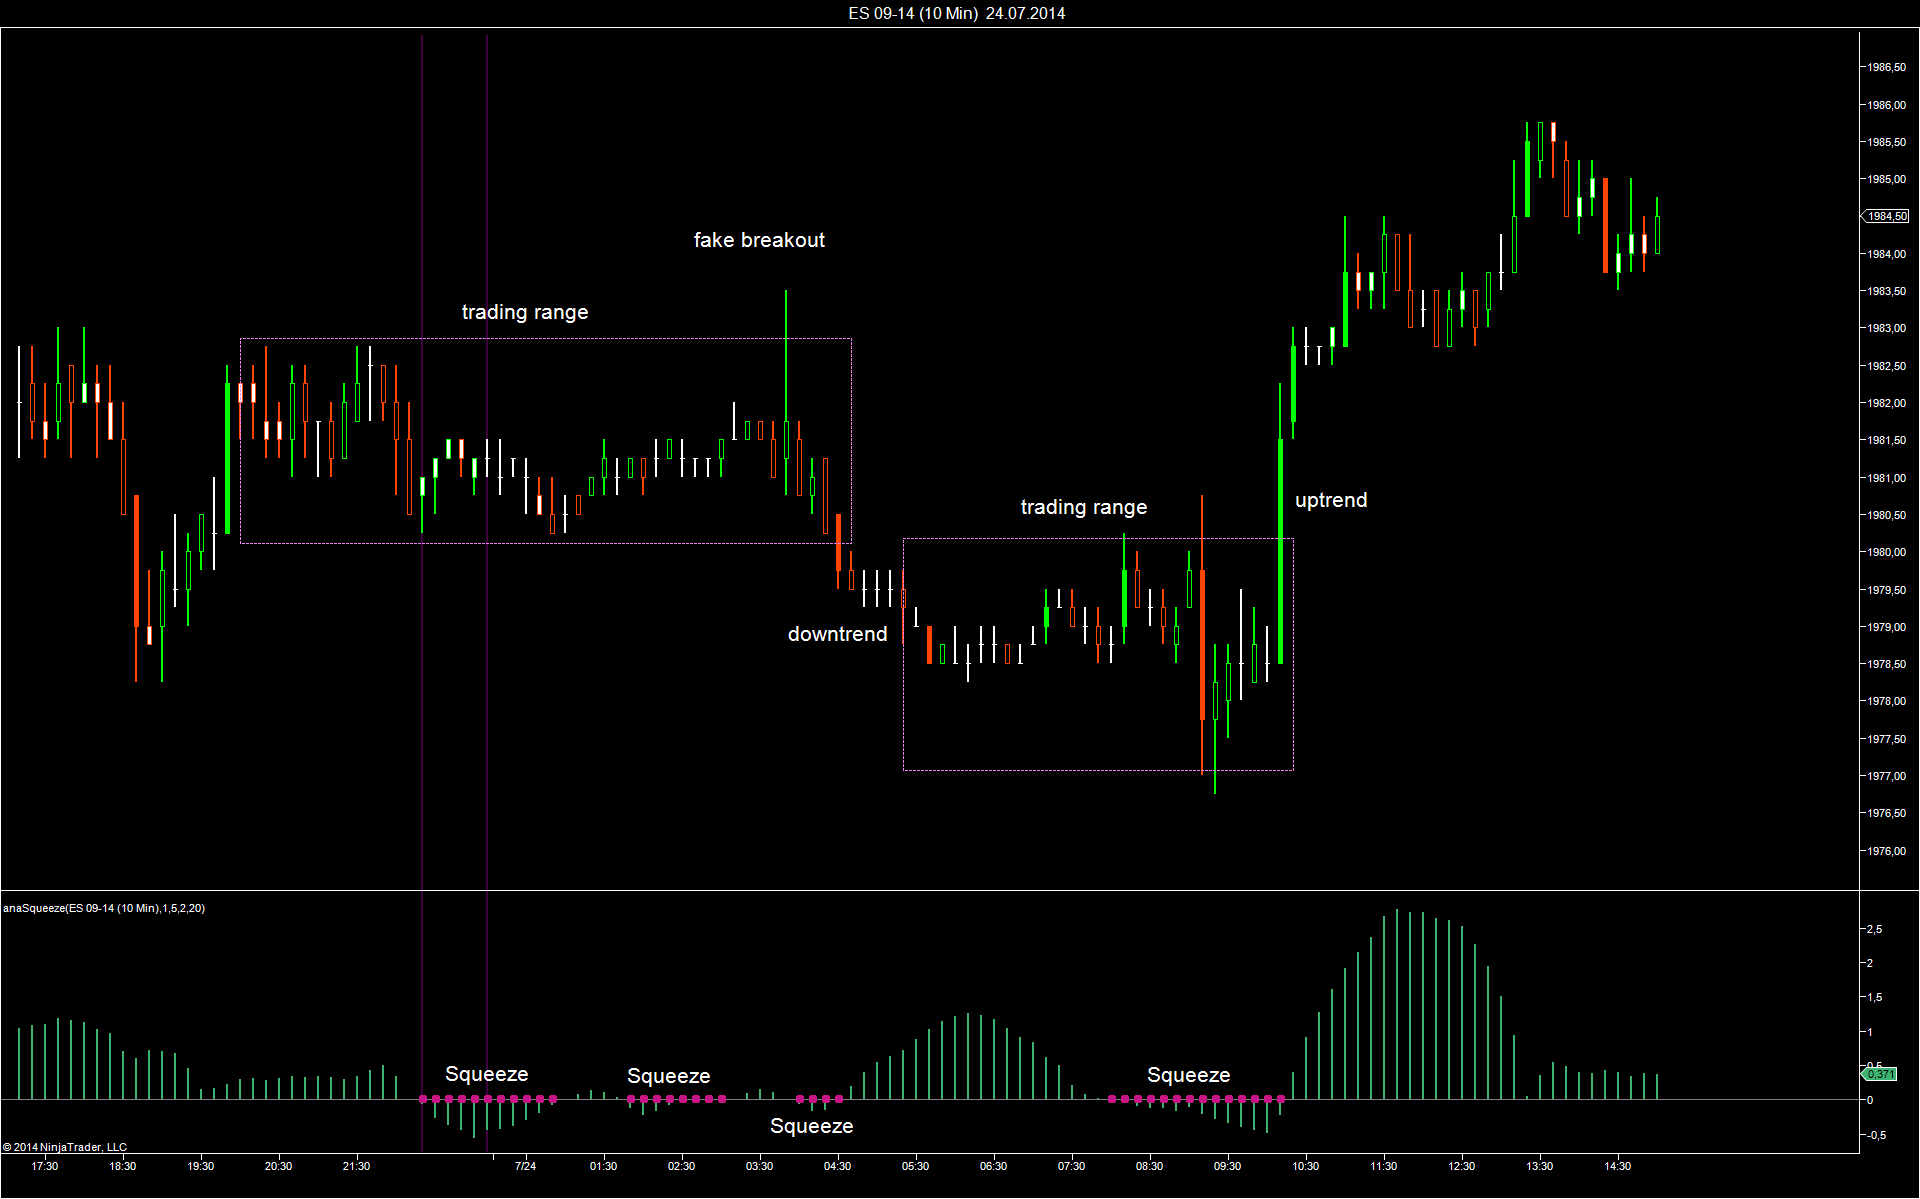
Breakout or fake breakout
The squeeze comes to an end when momentum picks up. If you want to enter a breakout trade, you need an additional indicator (such as momentum) and a higher timeframe trend filter to determine the direction of the breakout.
Histogram
The histogram shows (half of) the difference between the width of the Bollinger Bands and the width of the Keltner Channel. A histogram below the zeroline denotes weak momentum or range bound price action. A histogram above the zeroline shows that the market is trending. However, the histogram cannot be used to determine whether the trend is up or down. The indicator is rather comparable to Wilder's ADX.
|


