NexusFi: Find Your Edge


Home Menu


Omega Ratio by Keating and Shadwick


Discussion in Psychology and Money Management

Updated
      Top Posters
    1. looks_one Big Mike with 2 posts (4 thanks)
    2. looks_two SMCJB with 2 posts (2 thanks)
    3. looks_3 Quick Summary with 1 posts (0 thanks)
    4. looks_4 OneEye with 1 posts (2 thanks)
    1. trending_up 2,011 views
    2. thumb_up 8 thanks given
    3. group 2 followers
    1. forum 5 posts
    2. attach_file 1 attachments


Search this Thread

Omega Ratio by Keating and Shadwick

  #1 (permalink)
 
Big Mike's Avatar
 Big Mike 
Manta, Ecuador
Site Administrator
Developer
Swing Trader
 
Experience: Advanced
Platform: Custom solution
Broker: IBKR
Trading: Stocks & Futures
Frequency: Every few days
Duration: Weeks
Posts: 50,469 since Jun 2009
Thanks Given: 33,246
Thanks Received: 101,669

Paper:

https://faculty.fuqua.duke.edu/~charvey/Teaching/BA453_2006/Keating_An_introduction_to.pdf


Is anyone using the Omega Ratio in their portfolios?

I am looking for measurements that work well with a portfolio with a large number of trades that are not easily influenced by outliers.

Mike


Join the free Markets Chat beta: one platform, all the trade rooms!

We're here to help: just ask the community or contact our Help Desk

Quick Links: Change your Username or Register as a Vendor
Searching for trading reviews? Review this list
Lifetime Elite Membership: Sign-up for only $149 USD
Exclusive money saving offers from our Site Sponsors: Browse Offers
Report problems with the site: Using the NexusFi changelog thread
Attached Thumbnails
Omega Ratio by Keating and Shadwick-keating_an_introduction_to.pdf  
Follow me on Twitter Visit my NexusFi Trade Journal Started this thread Reply With Quote

Can you help answer these questions
from other members on NexusFi?
NT7 Indicator Script Troubleshooting - Camarilla Pivots
NinjaTrader
MC PL editor upgrade
MultiCharts
What broker to use for trading palladium futures
Commodities
Trade idea based off three indicators.
Traders Hideout
Quantum physics & Trading dynamics
The Elite Circle
 
  #3 (permalink)
 
Big Mike's Avatar
 Big Mike 
Manta, Ecuador
Site Administrator
Developer
Swing Trader
 
Experience: Advanced
Platform: Custom solution
Broker: IBKR
Trading: Stocks & Futures
Frequency: Every few days
Duration: Weeks
Posts: 50,469 since Jun 2009
Thanks Given: 33,246
Thanks Received: 101,669


R's PerformanceAnalytics package already includes Omega, for those who are using R.

 
Code
function (R, L = 0, method = c("simple", "interp", "binomial", 
    "blackscholes"), output = c("point", "full"), Rf = 0, ...) 
{
    method = method[1]
    output = output[1]
    if (is.vector(R)) {
        x = na.omit(R)
        switch(method, simple = {
            numerator = exp(-Rf) * mean(pmax(x - L, 0))
            denominator = exp(-Rf) * mean(pmax(L - x, 0))
            omega = numerator/denominator
        }, binomial = {
            warning("binomial method not yet implemented, using interp")
            method = "interp"
        }, blackscholes = {
            warning("blackscholes method not yet implemented, using interp")
            method = "interp"
        }, interp = {
            a = min(x)
            b = max(x)
            xcdf = Hmisc:::Ecdf.default(x, pl = FALSE)
            f <- approxfun(xcdf$x, xcdf$y, method = "linear", 
                ties = "ordered")
            if (output == "full") {
                omega = as.matrix(cumsum(1 - f(xcdf$x))/cumsum(f(xcdf$x)))
                names(omega) = xcdf$x
            } else {
                omegafull = cumsum(1 - f(xcdf$x))/cumsum(f(xcdf$x))
                g <- approxfun(xcdf$x, omegafull, method = "linear", 
                  ties = "ordered")
                omega = g(L)
            }
        })
        result = omega
        return(result)
    }
    else {
        if (length(Rf) > 1) 
            Rf <- mean(Rf)
        if (length(L) > 1) 
            L <- mean(L)
        R = checkData(R, method = "matrix", ... = ...)
        if (output == "full") 
            R = R[, 1, drop = FALSE]
        result = apply(R, 2, Omega, L = L, method = method, output = output, 
            Rf = Rf, ... = ...)
        if (output != "full") {
            dim(result) = c(1, NCOL(R))
            rownames(result) = paste("Omega (L = ", round(L * 
                100, 1), "%)", sep = "")
        }
        colnames(result) = colnames(R)
        return(result)
    }
}
Mike


Join the free Markets Chat beta: one platform, all the trade rooms!

We're here to help: just ask the community or contact our Help Desk

Quick Links: Change your Username or Register as a Vendor
Searching for trading reviews? Review this list
Lifetime Elite Membership: Sign-up for only $149 USD
Exclusive money saving offers from our Site Sponsors: Browse Offers
Report problems with the site: Using the NexusFi changelog thread
Follow me on Twitter Visit my NexusFi Trade Journal Started this thread Reply With Quote
  #4 (permalink)
 
SMCJB's Avatar
 SMCJB 
Houston TX
Legendary Market Wizard
 
Experience: Advanced
Platform: TT and Stellar
Broker: Advantage Futures
Trading: Primarily Energy but also a little Equities, Fixed Income, Metals and Crypto.
Frequency: Many times daily
Duration: Never
Posts: 5,049 since Dec 2013
Thanks Given: 4,388
Thanks Received: 10,207

Little bit of forum necromancy here, trying to bring alive a five year old post.

WOW. Simply WOW. I knew about Sharpe and it's problem of also penalizing good volatility and how Sortino attempts to fix that. I know about Sterling and Calmer. But I had never heard of the Omega Ratio. I'm very surprised that this thread got no responses at the time, and that futures.io has no other threads on Omega Ratio. The linked document is super interesting with explanations of the weaknesses of other methods* and how Omega includes higher moments of distributions.

The obvious issue is that other metrics (like Sortino) give you a single number, while Omega is dependent upon your desired rate of return. Portfolio A might be better than B when you want a X% return, but B is better than A when you want Y%. But is it as simple as X and Y? Aren't we generally just looking for the highest return, with the lowest risk?**

* The illustration of the flaws of a Sharpe Optimal Portfolio was excellent but the lack of an explanation of how you would construct and Omega Optimal Portfolio was disappointing!
** Haven't investigated this in anyway, but writing this I just thought maybe a ratio of two different Omega's, say the Omega of a zero return divided by the Omega of -10% return but be interesting

Reply With Quote
Thanked by:
  #5 (permalink)
 
SMCJB's Avatar
 SMCJB 
Houston TX
Legendary Market Wizard
 
Experience: Advanced
Platform: TT and Stellar
Broker: Advantage Futures
Trading: Primarily Energy but also a little Equities, Fixed Income, Metals and Crypto.
Frequency: Many times daily
Duration: Never
Posts: 5,049 since Dec 2013
Thanks Given: 4,388
Thanks Received: 10,207


SMCJB View Post
** Haven't investigated this in anyway, but writing this I just thought maybe a ratio of two different Omega's, say the Omega of a zero return divided by the Omega of -10% return but be interesting

Wouldn't be a ratio because you want both of the Omega scores to be as high as possible, so maybe sum or product.

Reply With Quote
Thanked by:
  #6 (permalink)
 OneEye 
The Netherlands
 
Experience: Intermediate
Platform: proprietary
Trading: ES
Posts: 41 since Dec 2017
Thanks Given: 151
Thanks Received: 58

Hi SMCJB,

I can't insert links, but if you search on "calculate-the-omega-ratio-with-excel" you'll find an article about Omega ratio.

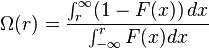
I have found the following description:

The Omega Ratio contains much more information about the return distribution, including the mean, variance, skew and kurtosis and is especially valuable for non-normal investments (such as Hedge funds, options, futures and derivatives).
Several years ago, hedge funds were subject to large losses which were in no small part due reliance on standard mean-variance optimization techniques (as pioneered by Markowitz). These approaches use mean and variance as a proxy for risk. However, this presupposes normally distributed returns; this is not the case for leveraged investments like hedge funds. Since then, the Omega Ratio and other similar approaches have grown in popularity because they favour investments with a lower probability of extreme loss.

The article also has source code as how to calculate Omega in Excel / VB.
I coded it in C++.

===

I have an automatic trading system. Part of the system evaluation are Sharpe ratio, Sortino ratio, Kelly criterium and Omega ratio.

One could calculate Sharpe ratio by hand. IMO for Sortino, Kelly and Omega manual calculations are not practical.

I find Sharpe and Sortio still valuable for a quick estimation of profitability & risk, Kelly is good for position sizing.

I use Omega to establish system profitability in respect to costs (= minimum profitability threshold). I set my minimum required profitability at 100 USD per day. An Omega of 1.0 or larger indicates I expect to cover 100 USD on costs per day. Calculation are including spread and commissions.

Reply With Quote
Thanked by:


Last Updated on July 1, 2019


© 2024 NexusFi™, s.a., All Rights Reserved.
Av Ricardo J. Alfaro, Century Tower, Panama City, Panama, Ph: +507 833-9432 (Panama and Intl), +1 888-312-3001 (USA and Canada)
All information is for educational use only and is not investment advice. There is a substantial risk of loss in trading commodity futures, stocks, options and foreign exchange products. Past performance is not indicative of future results.
About Us - Contact Us - Site Rules, Acceptable Use, and Terms and Conditions - Privacy Policy - Downloads - Top
no new posts