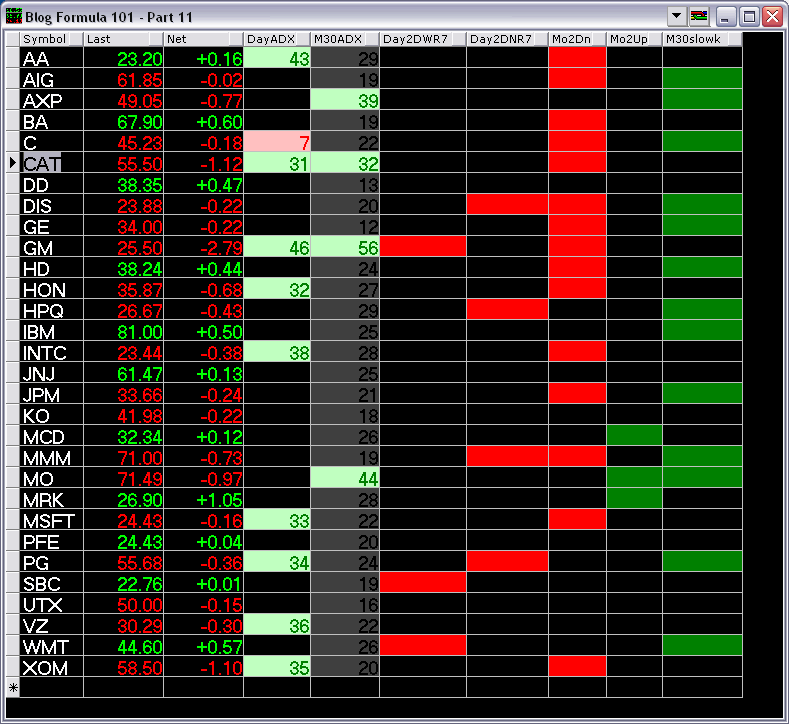
I am going to show you a trade plan a worksheet with all the important information that a trader use for making their trading decisions in the next trading day on the symbols he/she trades.
A Trade Plan (a.k.a Cheat Sheet)
This is the classic way how most successful traders trade based on their worksheets from previous day analysis. (Now you know for sure I came from the camp of chart reading.) All the essential information are summarized into the worksheets so that they do not need to refer to anything else when they need to make critical decisions about the existing positions and possible commitment into new positions.
Here is the package file for the example trade plan,
EOD Trade Plan. You can simply import this package file into NeoTicker using the Group menu>Import Package command. You will then get a group called Blog Formula 101 Part 11 that has the quote window I am showing here.
What does a trade plan do?
A trade plan should only identify the most trusted trading setups that you use for discretionary trading. The Dow 30 are used here as an example showing what you can do with a trade plan. You can sure use your own basket and your own set of indicators once you get an idea how to do it properly.
Here is the screeshot of the trade plan constructed from a quote window with quote formulas,
In case you are interested the
screenshot is taken in the evening on October 10, 2005.
I will describe what this trade plan does column by column.
I like looking at ADX at both daily level and 30-minute level. If both time frame are showing strength, no matter what direction, I know there are some good swings that can be jumped onto when the opportunity shows up. When both ADX dries up (at very low level), it is a sign that you should avoid that issue because there is nothing to trade. (Column DayADX and M30ADX)
Wide
range days is one of the most important setup if the
exhaustion does lead to a pause of any kind, then taking the trade in the opposite direction (initially) or simply doing 2-way trades (sell strength buy weakness) can be very good opportunities. (column Day2DWR7)
Narrowest range days are also one of the most important setup leading to possible break out scenerio if the opening of the next day confirms the setup. (column Day2DNR7)
Now, 2-day
momentum that just turned around. It is an important clue if the shorter term momentum is confirming the directional change. (Column Mo2Dn and Mo2Up)
Finally, slowk on 30-minute time frame, that I use for confirmation of directional change and possible overbought and oversold setups. They are the lifesavers when the daily setups do not confirm with these setups. (Column M30SlowK)
To see the formulas just double click on the columns will do.
Using the Trade Plan
Many traders like to print out their trade plans and have that readily available either right next to their trading computers, or, taking
screenshots of the quote window and have the picture opened on the computers so that they can refer to it any time.
Some traders also put extra handwritten notes on the printouts so that they can remind themselves what other possible clues they have figured out when they are doing their homework.
Talking about homework most traders who use trade plans like to walk-thru at least a few charts per symbol so that they are familar with the possible scenarios and pick out the strongest setups so that they can concentrate on the ones with best payoff opportunities as oppose to watching every single symbols in real-time.
Setting Up Your Own Trade Plan
It is not hard at all setting up your own trade plan. The key here is to choose the indicators that you trusted most and clearly know what you are looking for from the indicators. It does not have to be trading signal. It could be just a criteria you look for, something that helps you filter out the chart setups that you do not want to deal with. For example, the extremely low ADX reading is one of the favourite among many traders for identifying issues that are not suitable for daytrade.
The other most important thing you should remember is that it is your trade plan. It is a tool to get you started for the next day. It does not really stop you from taking trades that look good and when the opportunities popup. Thus, it is a tool, not a rule book, that you should follow, but not tied up to.
Summary
Technical analysis is not about reading an overbought or oversold level. It is about reading the scenario leading to the setup you have learned over time. A good trade plan includes the strongest and most trusted indicators you like to watch and highlights the basic setups that you care about so that it saves you time just like any other automation routines.
From a beginner standpoint, if you are not one of those super fast
scalpers and is just learning your way through, then develop your trade plan is a very good exercise that helps you concentrate and focus on the issues that you have chosen to trade. It also helps you distill your understanding of the indicators that you are learning to read properly.

