|
Aurora, Il USA
Experience: Advanced
Platform: TradeStation
Trading: futures
Posts: 5,854 since Nov 2010
Thanks Given: 3,295
Thanks Received: 3,364
|
It’s one of the biggest mysteries on Wall Street. How can stocks be in their fourth year of a [B]bull market[/B] and trading activity be so low?
 Getty Images During March, average daily volume in equity shares was at their lowest level since December 2007, according to new data from Credit Suisse. This is the same month that marked the three-year anniversary of the bull market that caused the Standard & Poor's 500 to double from its March 2009 credit-crisis low.
Credit Suisse tried to solve the riddle by blaming the growing popularity of [B]options[/B] and futures markets [IMG]http://media.cnbc.com/i/CNBC/Sections/News_And_Analysis/_News/_CNBC_EXPLAINS/_IMAGES/CNBC_explains_icon1.gif[/IMG] , a drop in high frequency trading and stock splits.
“There’s no way to sugar-coat it: Volumes are down and trending lower,” wrote Ana Avramovic of Credit Suisse, in a note to clients. “A growing preference for other asset classes may be drawing money away from equities.”
Daily equity volume in March was 6.59 billion shares a day, the lowest since a sub-6 billion volume month in December 2007, according to Credit Suisse. (The firm adjusted December 2011’s low figures to account for the holiday-skewed week.)
 Avramovic noted that options and futures volume set a record in 2011, as investors hungry to add risk looked for a place where they could use leverage. Avramovic noted that options and futures volume set a record in 2011, as investors hungry to add risk looked for a place where they could use leverage.
“The options market has been breaking records for nine straight years and the shift has been a growing field that provides protection and leverage,” said Pete Najarian, co-founder of TradeMonster.com, an options and equity brokerage.
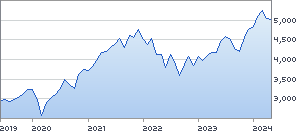
S&P 500 Index

(.SPX)
1358.59  -23.61 (-1.71%%) -23.61 (-1.71%%)
INDEX
The Credit Suisse analyst also notes that [B]high-frequency trading[/B], which accounts for half of all market activity, has been on the decline since last summer. What’s more, Citigroup [C 32.86 [IMG]http://media.cnbc.com/i/CNBC/CNBC_Images/componentbacks/watchlist_down.gif[/IMG] -1.11 (-3.27%) [IMG]http://media.cnbc.com/i/CNBC/CNBC_Images/backgrounds/realtime_icon.gif[/IMG]] alone accounted for 7 percent of all volume in the second half of 2009 before its 10 for 1 reverse split, according to the report.
But the answer may be simpler than this. After two vicious bear markets in a decade, the average investor simply doesn’t trust this market anymore.
“There is no fresh money going into the markets,” said [B]Doug Kass [/B]of Seabreeze Partners. “Why should we be surprised the retail investor is not there? We’ve had two huge drawdowns in stocks since 2000, a flash crash two years ago and real incomes are stagnating.”
Stock mutual fund flows are negative on the year despite a double-digit percentage gain for the S&P 500 in 2012. Meanwhile, bond funds of all kinds keep garnering more assets, even with interest rates in the basement.
Some investors blame [B]financial regulation[/B] for the poor volume, saying it has restricted trading activity by the major banks. But others believe the banks — and their hand in causing the worst financial crisis since the Great Depression — are ultimately to blame.
“The financial industry has placed itself above the investing public (" [B]muppets[/B]") and will take every advantage it can secure,” said Alan Newman, author of the Crosscurrents financial newsletter. “The public's confidence has been shattered, possibly beyond repair.”
News Headlines
|
