Welcome to NexusFi: the best trading community on the planet, with over 150,000 members Sign Up Now for Free
Genuine reviews from real traders, not fake reviews from stealth vendors
Quality education from leading professional traders
We are a friendly, helpful, and positive community
We do not tolerate rude behavior, trolling, or vendors advertising in posts
We are here to help, just let us know what you need
You'll need to register in order to view the content of the threads and start contributing to our community. It's free for basic access, or support us by becoming an Elite Member -- see if you qualify for a discount below.
-- Big Mike, Site Administrator
(If you already have an account, login at the top of the page)
------------Notes--------------
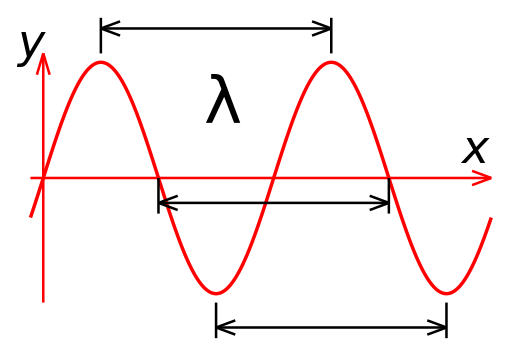
In the physical sciences, the wavenumber is a property of a wave, its spatial frequency, that is proportional to the reciprocal of the wavelength. It is also the magnitude of the wave vector. Its usual symbols are \scriptstyle\nu, \scriptstyle\tilde{\nu}, σ or k, the first three used for one definition, the last for another. The wavenumber has dimensions of reciprocal length, so its SI unit is m-1 and cgs unit cm−1 (in this context formerly called the kayser, after Heinrich Kayser). Wavenumber - Wikipedia, the free encyclopedia
In physics, a wave vector (also spelled wavevector) is a vector which helps describe a wave. Like any vector, it has a magnitude and direction, both of which are important: Its magnitude is either the wavenumber or angular wavenumber of the wave (inversely proportional to the wavelength), and its direction is ordinarily the direction of wave propagation (but not always, see below).
The wave vector can also be defined as a four-vector in the context of special relativity. Wave vector - Wikipedia, the free encyclopedia
In wave mechanics, the spatial frequency \nu is related to the wavelength \lambda by the formula
\nu = \frac{1}{\lambda}.
Likewise, the wave number k (e.g. in radians per meter) is related to spatial frequency and wavelength by
k = 2 \pi \nu = \frac{2 \pi}{\lambda}.
..........
peace, love and joy to you
.........
Can you help answer these questions from other members on NexusFi?
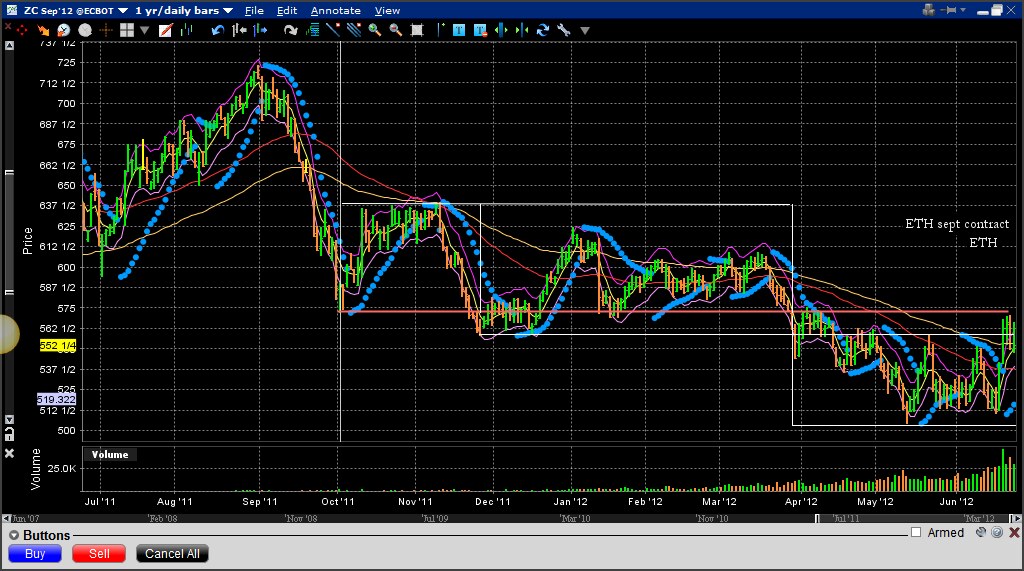
The first thing to notice is the general trend. Here the longterm trend is Down from last Sept's Peak. (720 area). After the first big drop it had a retracement.
The retracement height is important to measure. It is the rebound energy from the fall.
These numbers are not random. They are given by traders establishing equilibrium levels.
In the chart and video I show how this can be used to determine future turn points.
The height of the first bounce is measured.
I have show this as a box.
This height is duplicated below the box to estimate the level corn will fall to when it breaks the lower edge of the box (which was the first low from the big drop).
So this is reciprocal energy the first bounce up is matched by the drop down.
Possible trades are:
Short on breakdown at lower edge of the box,
Close short and reverse long at estimated low.
Close long at lower edge of the box.
a. If it goes through (on upward) go long with target=high of the box.
b. If it fails at the lower edge of the box go short, possible target = low (though this second time down you would a trail a buystop as it may not go all the way to the earlier estimated low.)
Though some traders would hold the long at the potential resistance (=the lower edge of the box) so they are still long - which worked in this case, I prefer to stand aside.
Nothing posted here is trading advice. Everything posted is educational information only. Futures and other trading involve the risk of loss. etc. etc..
Last week we said it would go up to 1355.50 (though I picked 1353 - haha) and it had a strong finish at 1338.25.
Buying at the open, selling at 1353 and closing at 1319 (the low was 1317.50 and 1319 was the gann number posted in Spoo-analysis), done with SPXU which is ultrashort S&P (so short CAR and close) using $30,000 would give us $7,128 on our $30,000 - using 50% margin.
This is 23.8% profit.
Notice that the 1355.50 area (1356.50 to be more precise) was shown - the higher dotted pink line.
Here is the week to 22 June with comments
Next week:
I'm looking for possible bounce to 1337 area - if it fails here go short
Possible levels to bounce off of:
Then down to 1307 area - if it bounces close short. I don't think it will so in that case stay short. There is a trendline there and its about 50%.
It could find a place to bounce at 1298 to1300 level - which is old lows and 5/8 retrace level - if it bounces close short.
If it has a bounce (say to 1317.50) then you're looking to go short again ONCE IT Fails.
We could easily be targeting the old lows 1262 (June basis) 1255.50 Sept basis.
Basically stay short green downtrend line.
.
Nothing posted here is trading advice. Everything posted is educational information only. Futures and other trading involve the risk of loss. yada, yada, yada....
GRAINS-Corn surges limit up as crop outlook dims48 minutes ago by Thomson Reuters
* CBOT Dec corn jumps to highest since Feb. 7 * Dryness continues to stress U.S. corn and soybeans * Weekend rains in France heighten quality concerns (Updates prices, adds new analyst quotes, changes byline, dateline, previously LONDON) By Michael Hirtzer CHICAGO, June 25 (Reuters) - U.S. corn futures surged the daily 40-cent limit, jumping to their highest since early February, as hot and dry weather in the big U.S. Midwest growing region reduced the outlook for yields. Corn futures for December delivery were headed for their biggest daily gain in the life of the contract at the Chicago Board of Trade while new-crop soybean futures advanced more than 3 percent after weekend rainfall disappointed and the extended forecast remained hot and dry. Grain futures bucked pressure from a firm dollar, lower equities and a sharp drop in crude oil. "The rainfall over the weekend was a bust. We thought we might see some scattered showers and that did not come through," said Citigroup analyst Sterling Smith in Chicago. "If we see these outside markets turn around, these grains could really catch fire." Analysts polled by Reuters predicted the U.S. Agriculture Department would reduce U.S. corn and soybean crop ratings late Monday by 2 to 3 percentage points while there was little rain in sight for the next 10 days. CBOT December corn was limit up at $5.94 cents per bushel, a gain of 7 percent. New-crop November soybeans rose 3.6 percent, or 50 cents, to $14.25-1/2 per bushel. Wheat futures joined the rally, buoyed additionally by diminished crop prospects in the Black Sea region. "It is very much a weather-related rally in this session," said Luke Mathews, commodities strategist at the Commonwealth Bank of Australia in Sydney. Macquarie Capital, in a report received on Monday, cut its forecast for the U.S. corn yield to 156.5 bushels an acre, significantly below the USDA's current forecast of 166 bushels. The U.S. government will update its production and yield forecast in its annual acreage report due on Friday. "Dry conditions through out the Midwest, specifically the Southern Corn Belt, following the completion of plantings has raised the risk of poor pollination for the U.S. crop," Macquarie Capital said. "These dry conditions have also been combined with the forecast of below-average precipitation all the way through to pollination," the report added. The deteriorating conditions have prompted large speculators to turn bullish while overall managed money has been increasing a net long position in corn. Large speculators took a net long position in CBOT corn futures and options, reversing course after taking a bearish short bet two weeks ago for the first time since the summer of 2010, regulatory data released on Friday showed. TIGHT STOCKS Corn and soybean crops in the U.S. Midwest have endured dry, hot conditions at a time when the market is relying on a bumper harvest to rebuild tight stocks. The U.S. corn stockpile is projected to fall to a 16-year low by Aug. 31. Wheat prices also rose, with CBOT July up 27-1/2 cents or 4 percent at $7.00-3/4 a bushel. "The drought in the U.S. is driving the rise," a European broker said, adding that concerns about a drop in quality to French wheat crops after new showers over the week-end added nervousness in the market. "It is still too early to speak about damages but it's in people's mind, that's for sure," he said. Prices at 9:33 a.m. CDT (1433 GMT) LAST NET PCT YTD CHG CHG CHG CBOT corn 619.25 28.25 4.8% -4.2% CBOT soy 1479.50 37.00 2.6% 23.4% CBOT meal 434.60 12.60 3.0% 40.5% CBOT soyoil 51.04 1.30 2.6% -2.0% CBOT wheat 700.75 27.50 4.1% 7.4% CBOT rice 1469.00 22.00 1.5% 0.6% EU wheat 222.75 6.25 2.9% 10.0% US crude 78.67 -1.09 -1.4% -20.4% Dow Jones 12,484 -157 -1.2% 2.2% Gold 1573.00 1.56 0.1% 0.6% Euro/dollar 1.2487 -0.0065 -0.5% -3.5% Dollar Index 82.5240 0.2680 0.3% 2.9% Baltic Freight 978 0 0.0% -43.7%
CANADA STOCKS-TSX near 3-week low as oil slips on euro zone fear48 minutes ago by Thomson Reuters
* TSX down 95.89 points, or 0.84 percent, at 11,339.65 * Energy stocks lead market lower as oil falls * Losses offset by gold miners, fertilizer producers By Allison Martell TORONTO, June 25 (Reuters) - Canada's main stock index fell on Monday, touching its lowest point in almost three weeks, led by weaker energy stocks as oil dropped, with investors worried about the euro zone debt crisis ahead of a European Union summit later this week. Global equity and commodity markets dropped on investor skepticism that a June 28-29 European summit would produce substantive measures to tackle the debt crisis. "These are indicators that are suggesting that the global growth environment isn't extremely healthy. Europe remains a very large cause for concern," said Marco Lettieri, economist at National Bank Financial in Montreal. "As a result there's a high risk premium that continues to be put on to the market." At about 10:35 a.m. (1435 GMT) The Toronto Stock Exchange's S&P/TSX composite index was down 95.89 points, or 0.84 percent, at 11,339.65. The index at one point hit 11,312.13, its weakest level since June 4. "It's just another day of being held hostage to headline risk," said Bruce Latimer, a trader at Dundee Securities. The heavyweight energy group played the biggest role in leading the market lower, dropping 2 percent. Financial issues declined 1.2 percent. Royal Bank of Canada fell 1.8 percent to C$51.03, while Suncor Energy fell 2 percent to C$27.69. The two companies played the biggest role of any stocks in pulling the TSX lower. Encana Corp was also among the major decliners, losing 3.4 percent to hit C$19.68. In addition to weaker energy prices, a Reuters investigation found that Encana plotted with Chesapeake Energy Corp to suppress land prices in Michigan. In response to questions from Reuters on the matter, Encana said it was undertaking an internal investigation. The only major TSX sector that rose was materials, helped by gold miners and fertilizer producers. Goldcorp Inc rose 1.5 percent to C$38.53 as gold prices held above $1,570 an ounce, following a sharp correction last week. Shares of Potash Corp rose 3.3 percent to C$42.73 and Agrium Inc was 1.1 percent higher at C$87.83 after corn futures rose on the Chicago Board of Trade, as dry weather threatened to cause more harm to the U.S. corn crop. Shares of the fertilizer makers typically track the prices of fertilizer-intensive corn closely, as higher grain prices are likely to spur farmers to increase crop nutrient utilization.
Nothing posted here is trading advice. Everything posted is educational information only. Futures and other trading involve the risk of loss. yada, yada, yada....
Rarely does anyone speak of the increase of the police/military state that is being engineered in the USA.
"Return to the principles of freedom, civil liberties of the person and self-reliance that our forefathers knew."
Nothing posted here is trading advice. Everything posted is educational information only. Futures and other trading involve the risk of loss. yada, yada, yada....