Welcome to NexusFi: the best trading community on the planet, with over 150,000 members Sign Up Now for Free
Genuine reviews from real traders, not fake reviews from stealth vendors
Quality education from leading professional traders
We are a friendly, helpful, and positive community
We do not tolerate rude behavior, trolling, or vendors advertising in posts
We are here to help, just let us know what you need
You'll need to register in order to view the content of the threads and start contributing to our community. It's free for basic access, or support us by becoming an Elite Member -- see if you qualify for a discount below.
-- Big Mike, Site Administrator
(If you already have an account, login at the top of the page)
I liked the price action strategy, but I think I want to try changing things up a bit to see how I do with a different risk/reward system and a different look at the market.
Viewing the internals, TICK, TRIN and VIX have given me a bit of context, and the indicators seem to give me areas of the chart to focus on.
While do pure price action, I found myself finding a lot of trades. Turns out there weren't that many trades to take. I found myself making mountains out of mole hills when the market was chopping sideways in a tight range.
In addition, the market has had historically low volatility these last few months. I think the price action breaks down a little bit with the low volume. Looking back at Mack's old charts, there are clear trend days, with clear signals. These days the pullbacks are shallower, and we mostly trade range days which I have trouble with.
I was also unhappy with the risk/reward system. I truly believe Mack makes most of his money off of runners, I was only trading 1 contract with a 1:2 reward:risk scenario. This means you have to have at least a 66% winrate to break even (I think). Being right 66% of the time is tough.
Overall, I want to incorporate price action into my trading. Especially trend lines and areas of support and resistance, but the specific rules may not be for me.
Can you help answer these questions from other members on NexusFi?
Internation markets are mostly down
/VX is up
bonds are slightly down
Oil is pretty much neutral
We pushed to new ATHs after hours, but after that quickly plummeted. We're currently bouncing off of yesterday's S2, and a S/R area.
S/R areas:
2578
2572
2569 - This area has seen a lot of notable resistance the past few weeks.
Overall outlook is negative for the day based off of the overnight activity.
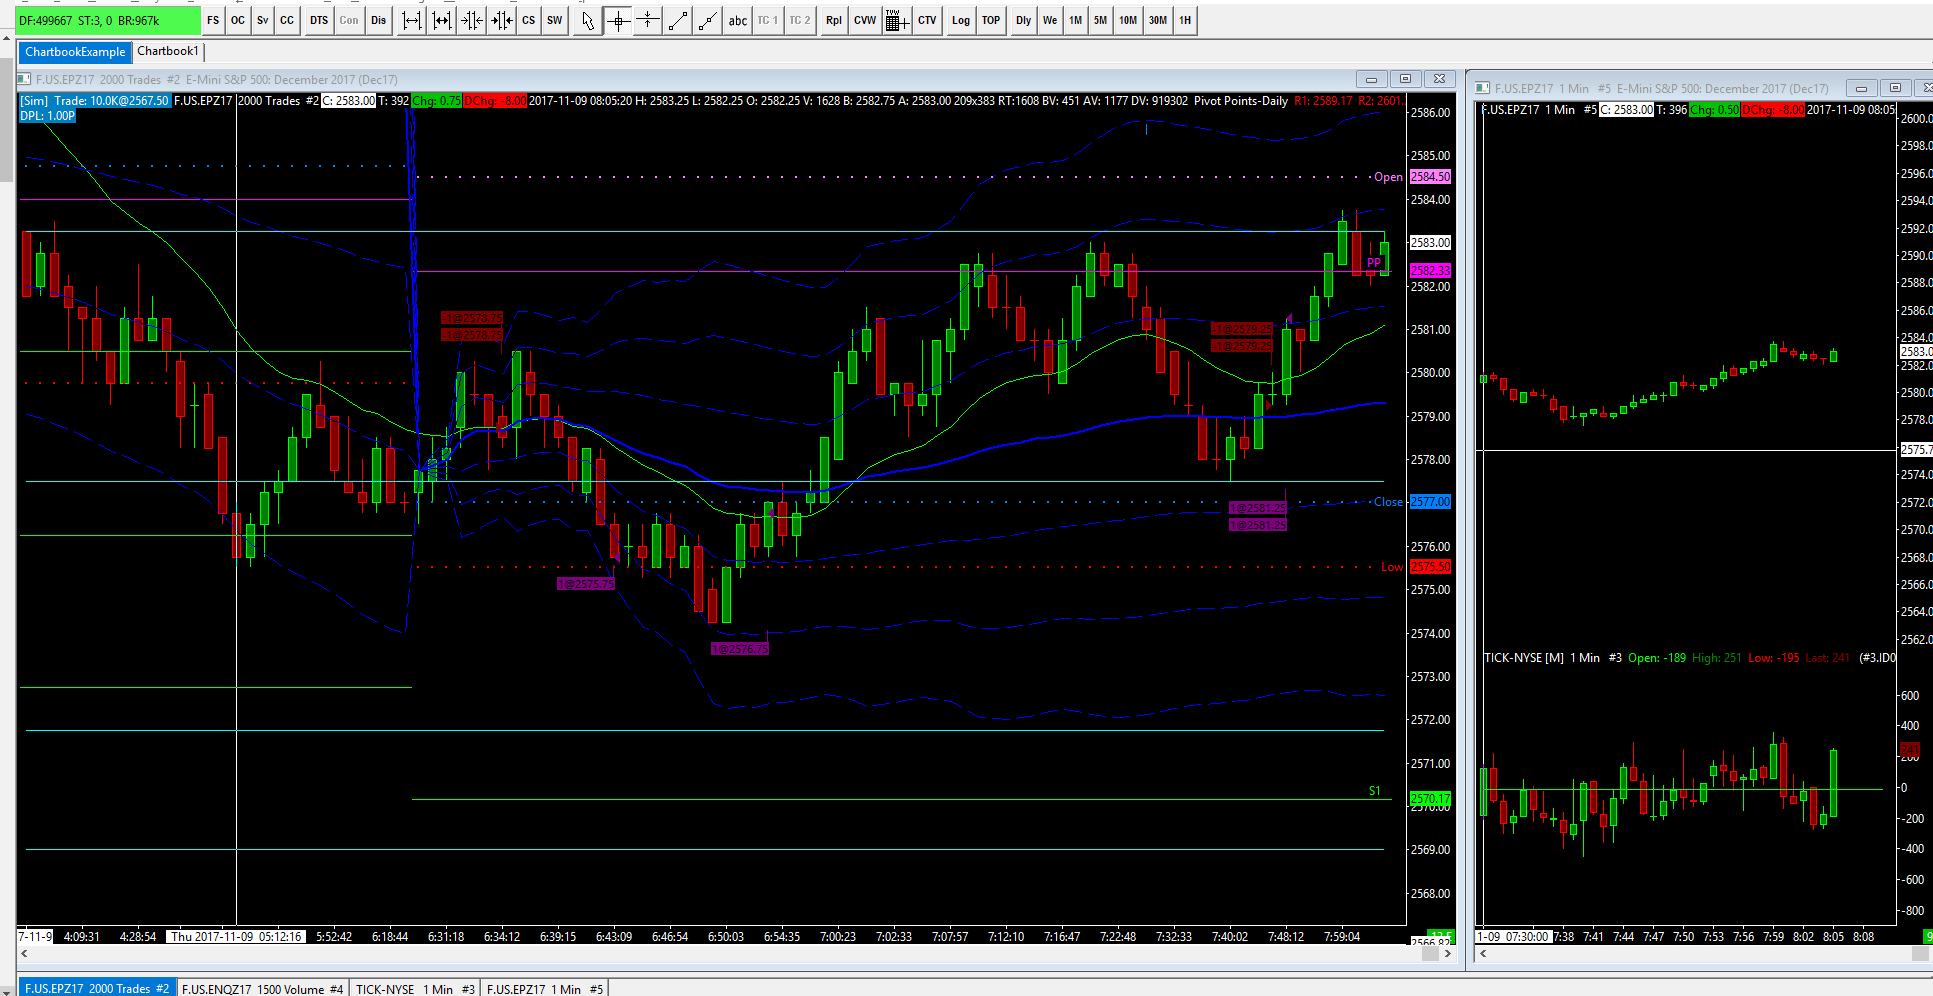
-Price has made a new higher right before market open.
-Price pushes higher to ysterdays low and starts to reverse at the 21 EMA, I execute my bias with a short at 2578.75.
Profit targets: 2575.75, and 2573.75
Stop @: 2581.75
- This is a 2nd entry low after a pullback to the EMA during a downtrend, price immediately reverses for 2 points, but I decide to hang on and let the market prove me wrong either way.
- Profit target 1 is hit, price is now at overnight low and is bouncing a bit. I move my stop to -1pt, locking in at least 2 points of profit.
- Price breaks through overnight lows and comes within 2 ticks of my profit target and reverses to EMA.
- With VIX falling, and TICK creeping upward, I close the trade at 2576.75 for 5 total points of profit.
- Perhaps I closed too soon, only time will tell. At least I made a decent profit on the trade. Looks like I closed the trade at a good time. Price reversed hard, and comes within 1 tick of my original stop at 2581.75 then reverses almost to the ema.
- TICK and price diverge at 7:10am PST. Price bounces off the pivot point and reverses to probably the ema at around 2080. I am tempted for a quick scalp, but decide I am too late to the party. I noticed it but didn't trade it with conviction.
- Market does reverse to the EMA, and bounces off the EMA/trendline I have drawn then goes peaks back above the pivot point making a new high by 1 tick, and reverses.
- TICK is making lower highs and lower lows. price breaks through my trendline and the EMA at 7:32am
Spotting the reversal in retrospect: At 7:10 price peaked at 2582.75, and a divergence of TICK and price occured. Price reversed shortly after to the EMA, and came back to test the highs. At 7:20am there was another strong divergence of Price and TICK with price peaking at 2583.00, essentially double topping then reversing strongly to an area of S/R at 2577.50.
7:45am price pulled back to the EMA, I expect another leg down and will watch for Price/tick divergences.
I find one, and trade with conviction. Short at 2579.25.
Stop at 2581.25
Profit targets at 2578.25, and 2577.25
Price quickly reversed and took out my stop. -4pts.
What went wrong: I was too caught up in my bias, we were on a clear uptrend, and I got cheeky trying to short on a 2 legged move down. I need to work on my entry signals. The price divergence was clear, but 7:45am, but TICK was making higher lows and new highs.
Price chopped around and went slightly higher until the London open, where it then fell to 2572. It has slowly been filling some of the gap since then. It wouldn't surpise me if price went to the 2583 area upon open, and then turned around there.
There was a lot of movement yesterday in the ES, hopefully we can repeat that.
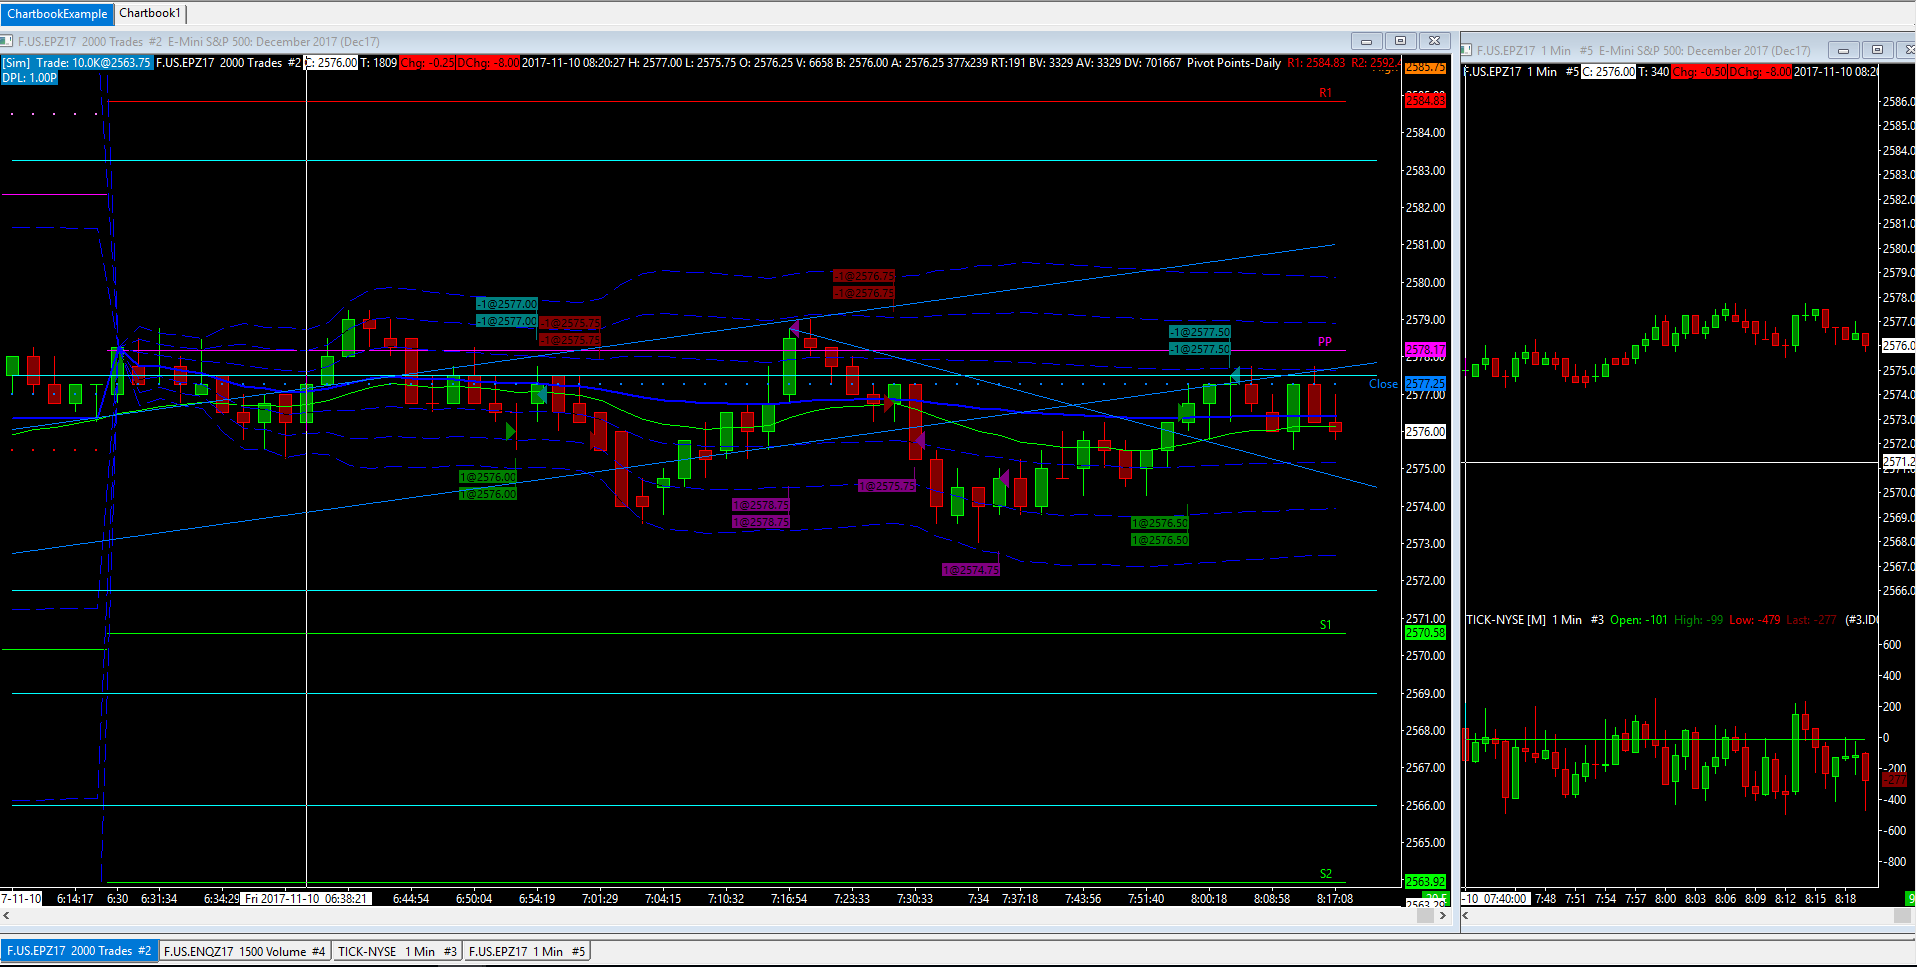
- Market opens and the opening range is very tight, 2578.75 to 2576.25. It's tempting to go short, but I'm going to stay out of the chop. TICK is pretty neutral, vix is rising, TRIN is kind of confusing.
- 6:37: We break below the opening range, but can't close outside of it.
6:40: Price breaks above opening range and closes above pivot point. TICK moving up, VIX moving down
6:47: TICK has yet to make any extreme moves, staying +/- 250ish, found the price channel I think. We're moving in a slow upward direction, kind of looking for a 2nd leg down though. Going to try not to fight the trend, might go or a quick long scalp
Price breaks below my channel, I should've waited for a close below it though, TICK was making lower lows and a lower high, VIX was spiking, I try to go short at 2576, but misclicked and go long instead. I quickly exit with 2 points of profit after realizing my mistake.
+2pts.
6:55: we're back in my price channel though, and I got my scalp...
6:58: looks like a failed 2nd entry long occured near the ema, but price has yet to close outside the trend channel. It it does, looking for 2572 - 2570.
7:02 Price breaks below, and I drop an actual sell order at 2575:75 for 2 contracts.
7:14 Price moved immediately in my favor 2.25 points, and then quickly rebounded to the EMA/my break even. Price VIX has been on a steady decline, although it appears we can't break through the EMA. Moving profit targets up to 2 and 4 points, leaving stop where it is for a 1:1 R:R.
7:18 Price has reversed and broken through my stop. -6 points. I'm a bit frustrated, I feel I recognized a good opportunity but failed to capitalize on it. At one point I had 4pts of profit, but now I'm left in the hole for the day. Looking at the chart, I also made mountains out of mole hills. It was silly to think a 5pt move was going to come out of a market that was essentially chopping sideways, perhaps a tighter stop and profit target for next time?
7:26: Price has peaked at the morning high, and is back to the bottom of the trend channel, peaking below.
7:30ish: Price reentered the trend channel, and tested the RTH highs, but could not break above, then reversed, and this was probably revenge trading, but I shorted at 2576.75. First contract at 1pt of profit, 2nd contract was to be managed at my discretion. With a 2pt stop loss for both. Price quickly filled the first point, and reached the days lows, but was unable to break through as of 7:37am. I closed for a total gain of +3pts.
7:40: Price is chopping around the RTH lows. We're probably in a trading range.
8:00: Price has been grinding higher, and is now at a 2nd entry long. I get in a bit late, but I expect us to hit the 2578.50 area, I'm taking a quick long for 1pt on 2 contracts.
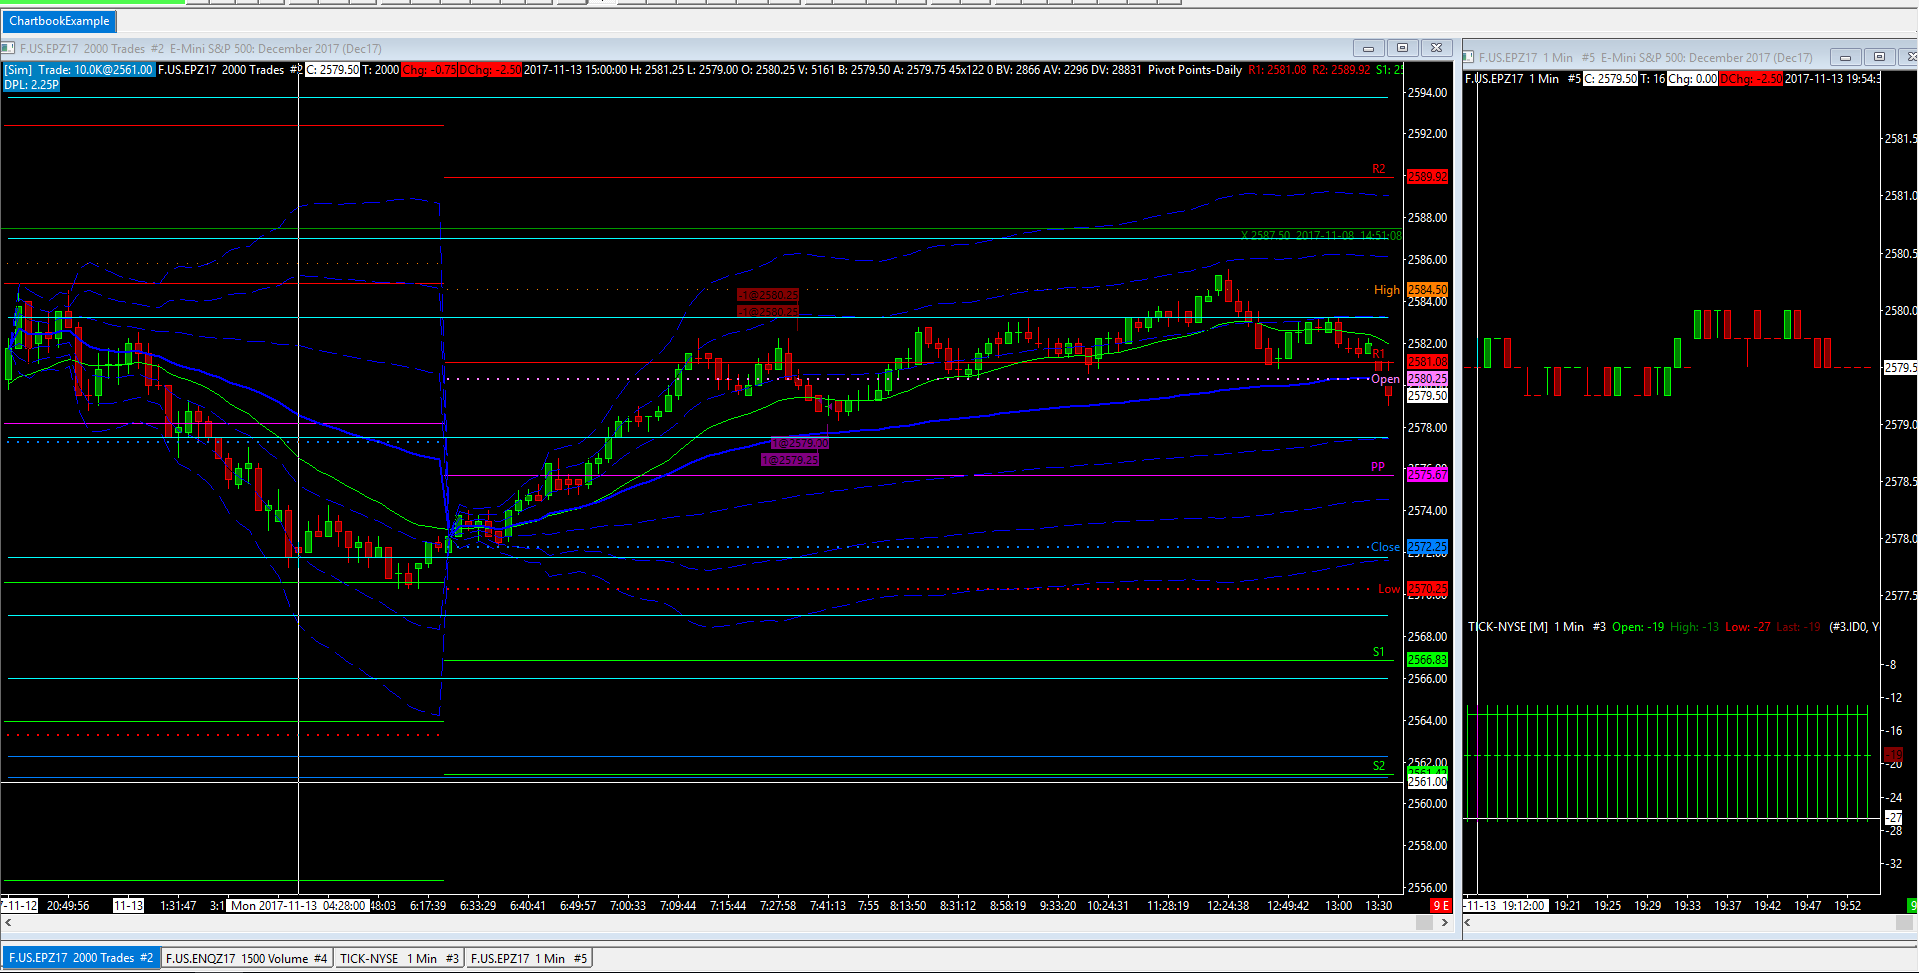
I came in late today, so I wasn't able to do a proper pre-market analysis. However it was easy to see that the market was in a steady decline until right before the open of regular trading hours.
I took 1 trade today, a short at 2580.25, which occurred at a "double top" when we bounced off the 2582.25 line, which was the Sunday open area.
Target 1: 2579.25
Target 2: 2 points, or discretionary.
I figured after immediate rejection at the area of S/R we were at least going back to the EMA. Once the first target was hit I moved my stop to 2581.25, making it a free trade. I closed the second contract just below the EMA after it appeared price was going to move against me.
+2.25 points.
The rest of the day was incredibly slow while the market drifted upwards, only to drop a bit right before close.
Right now I'm focusing on trading S/R areas, combined with things with pivot points and VWAP bands.
As for specific entry points, this is something I think I need to work on. The ES has been shallow lately, and half a point can count towards a lot. I haven't been getting the entries I should be getting and need to focus on them more.