Welcome to NexusFi: the best trading community on the planet, with over 150,000 members Sign Up Now for Free
Genuine reviews from real traders, not fake reviews from stealth vendors
Quality education from leading professional traders
We are a friendly, helpful, and positive community
We do not tolerate rude behavior, trolling, or vendors advertising in posts
We are here to help, just let us know what you need
You'll need to register in order to view the content of the threads and start contributing to our community. It's free for basic access, or support us by becoming an Elite Member -- see if you qualify for a discount below.
-- Big Mike, Site Administrator
(If you already have an account, login at the top of the page)
Lots of fear in the market ahead of next weeks FOMC meeting at which they may annouce 1st rate hike in 9 years. I'm thinking that no matter what the market will rally on the announcement., what ever it is
1. Everyone that really wants to be long is selling now.
2. The fear is driven by the uncertainty of what the FOMC will do.
3. Once the event is over the fear is gone.
a. if they don't raise rates: market is happy to continue investing with easy monoey
b. if they raise rates a quarter point ( widely expected amount ) then:
i) the fear of what will happen is over
ii) it's finally over and there's no worry about a December hike
iii) it's only a quarter point so it's still cheap to borrow.
Can you help answer these questions from other members on NexusFi?
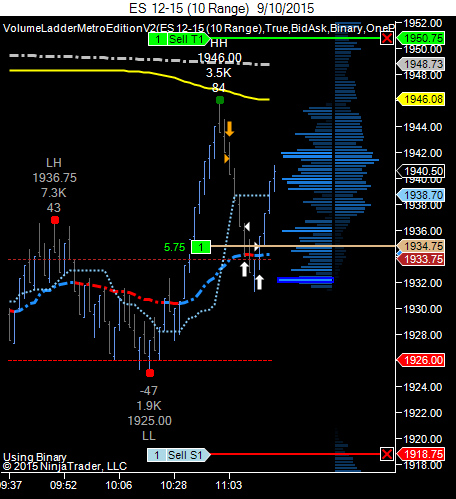
I don't really know how / what conditions to look for to expect that a choppy day will continue to be choppy. Therefore, I will not try to expect it. Instead I see a lot of congestion on the volume ladder in the choppy area.
I see price under the w-vwap and 50 bar adxvma.
I think I need price to get above w-vwap to confirm a reversal or below yesterday low to confirm continuation of yesterday's rout.
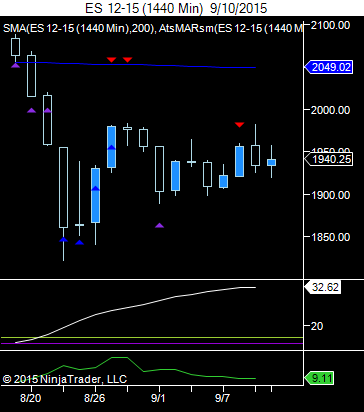
daily chart. On the daily chart we sold off hard yesterday and today chopping above yesterday close. Is it bearish that we formed a lower low today then yesterday, but we're off that low now?
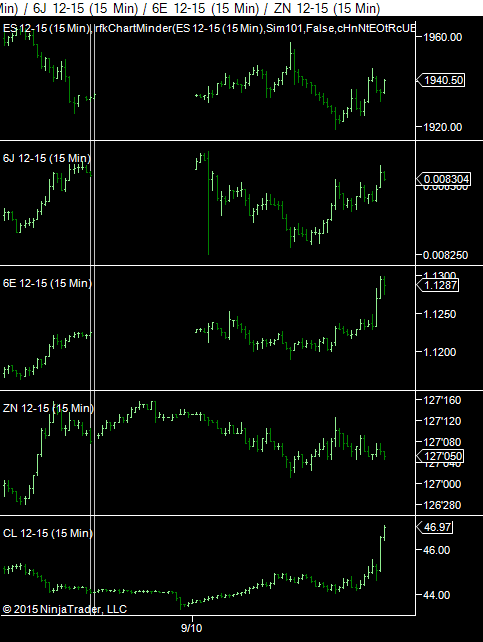
ZN ZT spreads
2nd panel is ZN / ZT
3rd panel is CME weighted PRICE 5*ZN - 9*ZT
3rd panel is more in line with the way I measure correlation of ES to spreads... but it's not based on returns like the correlation study is. Instead it's simply the weighted price.
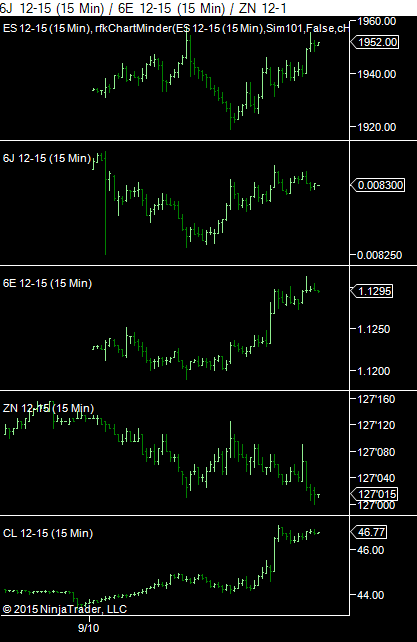
This graph is the natural log returns of the weighted 5*ZN - 9*ZT
The correct way to do it, the graph above, shows spreads widening as well ( like the 3rd panel in the 1st screen shot ). But it's difficult to see a trend using logarithmic returns.
@Oysteryx can you comment on how you watch spreads in your system?
Gotta say, if not trading curve spreads, and given that ES correlation is weaker with spreads than with outright bonds (assuming here ES is your main instrument), maybe better keep it simple and take the spreads off your screens .... could just look at the 2-10 spread on the daily chart for reference on curve flattening/steepening.