NexusFi: Find Your Edge


Home Menu


Like a turtle to his balcony...


Discussion in Trading Journals

Updated
      Top Posters
    1. looks_one GaryD with 1,625 posts (688 thanks)
    2. looks_two josh with 67 posts (106 thanks)
    3. looks_3 greenr with 51 posts (53 thanks)
    4. looks_4 Deucalion with 28 posts (77 thanks)
      Best Posters
    1. looks_one Deucalion with 2.8 thanks per post
    2. looks_two josh with 1.6 thanks per post
    3. looks_3 greenr with 1 thanks per post
    4. looks_4 GaryD with 0.4 thanks per post
    1. trending_up 227,157 views
    2. thumb_up 1,158 thanks given
    3. group 36 followers
    1. forum 1,905 posts
    2. attach_file 1,043 attachments


Search this Thread

Like a turtle to his balcony...

  #591 (permalink)
 
josh's Avatar
 josh 
Georgia, US
Legendary Market Wizard
 
Experience: None
Platform: SC
Broker: Denali+Rithmic
Trading: ES, NQ, YM
Posts: 6,235 since Jan 2011
Thanks Given: 6,775
Thanks Received: 18,223


GaryD View Post
OK, you caught me. I downloaded it, thought, ?, and decided NT was not that bad.

lol, you would have the same experience if you were going from Sierra to NT. NT is not easier, it's just very familiar to most people.

File->Data/Trade Service Settings, set up your account, max historical days set to a lot (mine is 60), intraday data storage time unit to 1 tick

File->Find Symbol, find it, then Open Intraday Chart, wait for it to download

Global Settings->Graphics Settings, set some colors/fonts/etc, and be sure that Chart->Graphics Settings has "Use global" checked, and to customize each chart simply uncheck this box

Window->Detach/Attach

Tools->Tool Settings, "Pointer" in first drop-down box, check "Support Left Click to Select Chart Drawings", "double click on drawing...", "enable drawn volume profile selection", "switch to pencil cursor", as a few options to get you started that I find useful

Global->Customize Chart Shortcut Menu allows you to assign any command to the right-click menu so you have fast access to drawing tools, and anything else you want, also keyboard shortcuts are completely customizable.

Chart->Chart Settings contains most of the essential chart information like hours, days to load, etc.

Right-click the price scale, and set "Interactive Scale: Move" and a left-click drag will move the scale, and a ctrl+Left-click draw will resize the scale. Clicking on the chart with the Pointer tool drags it, unless you have Chart->Show Scrollbar enabled, in which case you use the scrollbar to move. Tools->Chart Values/Crosshairs is a good tool, and you can turn on a global crosshair of course.

Tools->Draw volume profile is obvious, and on a new chart do Analysis->Studies and use the TPO chart for Market Profile, or Volume by Price for a volume profile (which you can also add to a TPO chart). You can right-click profiles in the TPO view and merge left-right, show letters in their own column, split profiles, and all that stuff.

You can create your own study collections that you can apply with Analysis->xyz, and studies are in Analysis->Studies. It is easy to do things like subtract one indicator value from another, overlay one instrument onto another, roll over your contract and manually shift prices/volume for a period, and the spreadsheet study lets you see your study and price/volume data in a spreadsheet that works just like excel, so you can do stats and the like easily, without having to do an export. It has a DOM which shows you 10 price levels and a profile. Everything updates 40ms (vs. 100ms in NT).

Oh yeah, and the main reason I initially switched: the extending rectangle tool. NT just couldn't fix the damn rectangle tool, and when the anchor points were too far off the visible chart area the whole thing would disappear. I missed quite a few trades because my shaded area disappeared because as time passed, the anchor points were off the chart. Zoom in and rectangle appears, zoom out and it disappears. Speaking of drawing tools, if you want to show your drawings in another chart, that's easy too, it's in settings.

It's fast, it's reliable, new functions come out all the time, new builds are about two per week. When there is a bug in SC, it gets fixed, and if they don't have time or don't want to, they tell you, instead of saying "We will add this to our request list" when they really mean "The list has hundreds of requests from years back and yet we have no intention of ever doing anything about it" like some vendors do.

In fact, just about everything is customizable, down to minute details about a chart's appearance. You can have a left scale, change the border color, show/hide region dividing lines, customize the text along the top line of a chart, and just about anything else. In fact, for every time I've wanted to customize something and couldn't, it was simply that I had not yet found the option.

Now I have officially gushed. Sorry for the long post, but this should get you started if you are willing. Sorry to derail, let me know if you have any questions.

Reply With Quote

Can you help answer these questions
from other members on NexusFi?
Exit Strategy
NinjaTrader
Better Renko Gaps
The Elite Circle
Trade idea based off three indicators.
Traders Hideout
Pivot Indicator like the old SwingTemp by Big Mike
NinjaTrader
How to apply profiles
Traders Hideout
 
Best Threads (Most Thanked)
in the last 7 days on NexusFi
Spoo-nalysis ES e-mini futures S&P 500
29 thanks
Just another trading journal: PA, Wyckoff & Trends
25 thanks
Tao te Trade: way of the WLD
24 thanks
Bigger Wins or Fewer Losses?
23 thanks
GFIs1 1 DAX trade per day journal
17 thanks
  #592 (permalink)
 greenr 
london/england
 
Experience: Advanced
Platform: Sierra charts, NinjaTrader, VK Trader
Broker: CQG, AMP, VK, Kinetick
Trading: CL/6E/TF/ES
Posts: 952 since Sep 2011
Thanks Given: 562
Thanks Received: 1,280


josh View Post
lol, you would have the same experience if you were going from Sierra to NT. NT is not easier, it's just very familiar to most people.

File->Data/Trade Service Settings, set up your account, max historical days set to a lot (mine is 60), intraday data storage time unit to 1 tick

File->Find Symbol, find it, then Open Intraday Chart, wait for it to download

Global Settings->Graphics Settings, set some colors/fonts/etc, and be sure that Chart->Graphics Settings has "Use global" checked, and to customize each chart simply uncheck this box

Window->Detach/Attach

Tools->Tool Settings, "Pointer" in first drop-down box, check "Support Left Click to Select Chart Drawings", "double click on drawing...", "enable drawn volume profile selection", "switch to pencil cursor", as a few options to get you started that I find useful

Global->Customize Chart Shortcut Menu allows you to assign any command to the right-click menu so you have fast access to drawing tools, and anything else you want, also keyboard shortcuts are completely customizable.

Chart->Chart Settings contains most of the essential chart information like hours, days to load, etc.

Right-click the price scale, and set "Interactive Scale: Move" and a left-click drag will move the scale, and a ctrl+Left-click draw will resize the scale. Clicking on the chart with the Pointer tool drags it, unless you have Chart->Show Scrollbar enabled, in which case you use the scrollbar to move. Tools->Chart Values/Crosshairs is a good tool, and you can turn on a global crosshair of course.

Tools->Draw volume profile is obvious, and on a new chart do Analysis->Studies and use the TPO chart for Market Profile, or Volume by Price for a volume profile (which you can also add to a TPO chart). You can right-click profiles in the TPO view and merge left-right, show letters in their own column, split profiles, and all that stuff.

You can create your own study collections that you can apply with Analysis->xyz, and studies are in Analysis->Studies. It is easy to do things like subtract one indicator value from another, overlay one instrument onto another, roll over your contract and manually shift prices/volume for a period, and the spreadsheet study lets you see your study and price/volume data in a spreadsheet that works just like excel, so you can do stats and the like easily, without having to do an export. It has a DOM which shows you 10 price levels and a profile. Everything updates 40ms (vs. 100ms in NT).

Oh yeah, and the main reason I initially switched: the extending rectangle tool. NT just couldn't fix the damn rectangle tool, and when the anchor points were too far off the visible chart area the whole thing would disappear. I missed quite a few trades because my shaded area disappeared because as time passed, the anchor points were off the chart. Zoom in and rectangle appears, zoom out and it disappears. Speaking of drawing tools, if you want to show your drawings in another chart, that's easy too, it's in settings.

It's fast, it's reliable, new functions come out all the time, new builds are about two per week. When there is a bug in SC, it gets fixed, and if they don't have time or don't want to, they tell you, instead of saying "We will add this to our request list" when they really mean "The list has hundreds of requests from years back and yet we have no intention of ever doing anything about it" like some vendors do.

In fact, just about everything is customizable, down to minute details about a chart's appearance. You can have a left scale, change the border color, show/hide region dividing lines, customize the text along the top line of a chart, and just about anything else. In fact, for every time I've wanted to customize something and couldn't, it was simply that I had not yet found the option.

Now I have officially gushed. Sorry for the long post, but this should get you started if you are willing. Sorry to derail, let me know if you have any questions.

Ninja trader sucks........end of story

Get sierra Gary 100%

Get out that comfort zone for the better

" I will follow my rules, I will take my stops, I will be disciplined and i will work with the market....NOT AGAINST IT! Professional mind control is the key"
Reply With Quote
  #593 (permalink)
 
GaryD's Avatar
 GaryD 
Orlando, Florida
 
Experience: None
Platform: shoes
Trading: happy
Posts: 6,462 since May 2011


On the upper end there is OTF down, lower end, poor bottom (poor low). Expecting lower, then retrun to balance


Started this thread Reply With Quote
  #594 (permalink)
 
GaryD's Avatar
 GaryD 
Orlando, Florida
 
Experience: None
Platform: shoes
Trading: happy
Posts: 6,462 since May 2011

Price has been riding the lower end of vaule


Started this thread Reply With Quote
  #595 (permalink)
 
GaryD's Avatar
 GaryD 
Orlando, Florida
 
Experience: None
Platform: shoes
Trading: happy
Posts: 6,462 since May 2011

Euro is broadening, keeping direction ambiguous


Started this thread Reply With Quote
  #596 (permalink)
 
GaryD's Avatar
 GaryD 
Orlando, Florida
 
Experience: None
Platform: shoes
Trading: happy
Posts: 6,462 since May 2011

ETH shows initiative buying tail, which is supporting a drive back to balance if it sets a good low, responsive buying


Started this thread Reply With Quote
  #597 (permalink)
 
GaryD's Avatar
 GaryD 
Orlando, Florida
 
Experience: None
Platform: shoes
Trading: happy
Posts: 6,462 since May 2011


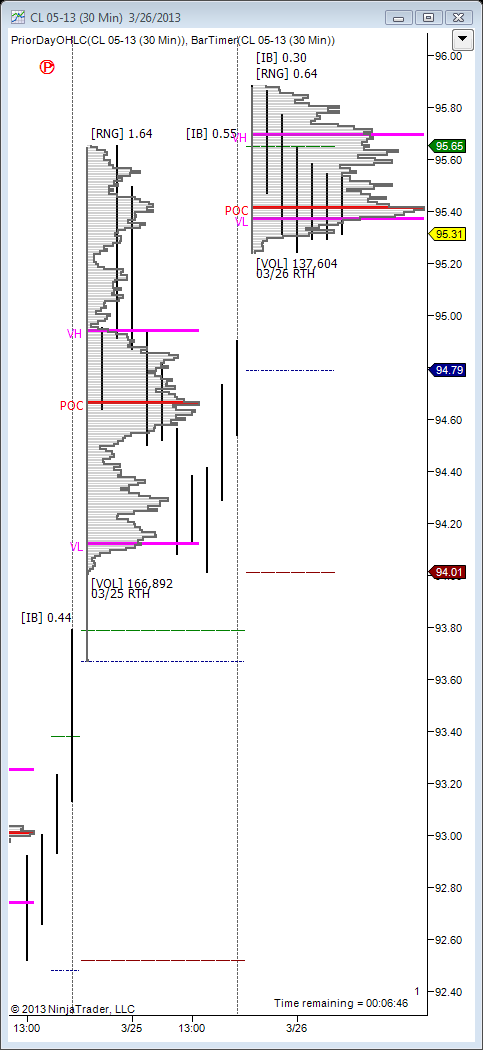
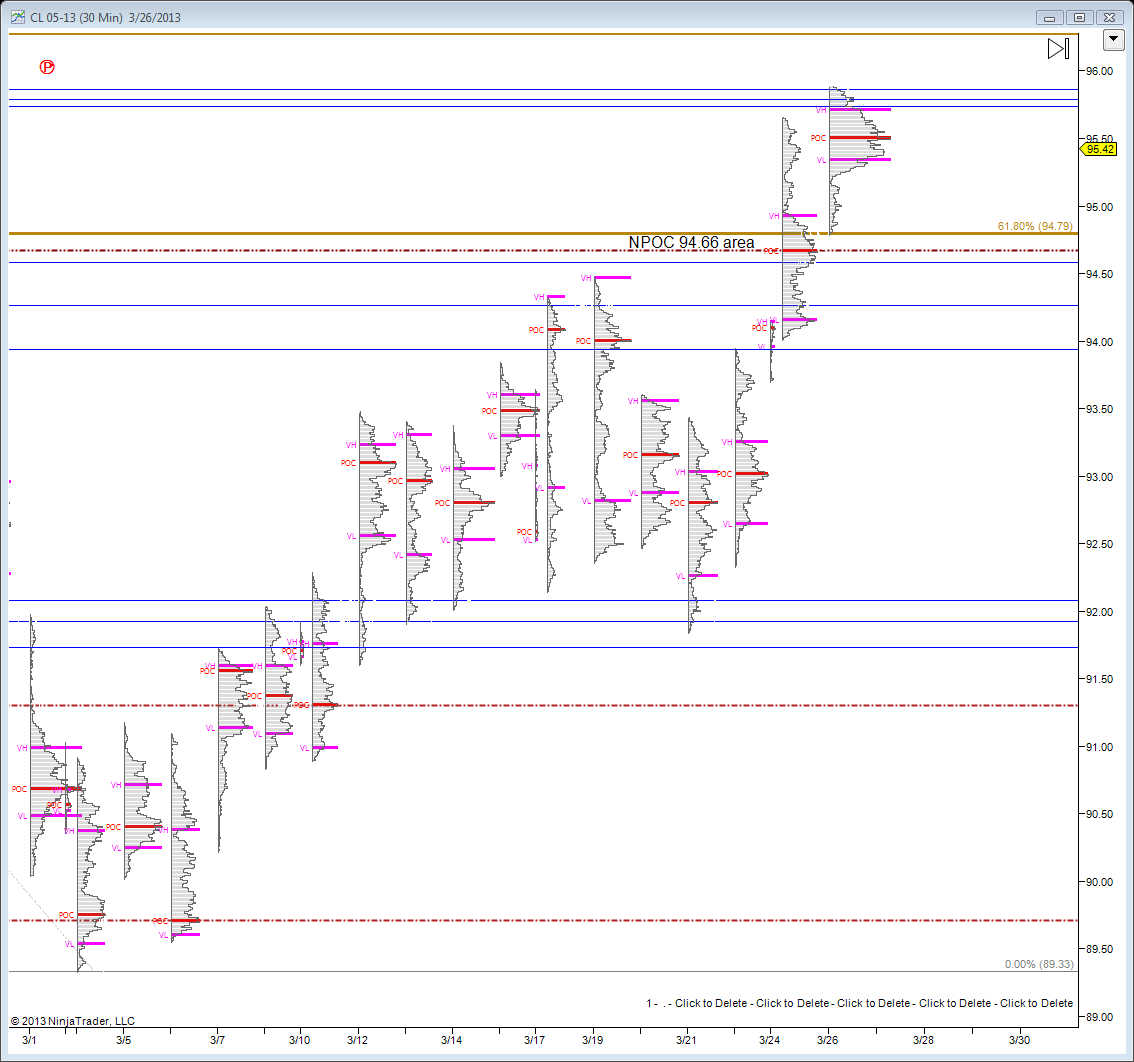
NPOC confluence with reverse 618, prior confirmation


I am flat, but if I were in it would be short, expecting at least a better low, and exit confirmation a break above RTH VWAP


The reason I can't get in here is the distance from risk, but, at this point in the game there is enough evidence of shorts that a move higher could exceed value... This is very brain stretching...

Started this thread Reply With Quote
  #598 (permalink)
 
GaryD's Avatar
 GaryD 
Orlando, Florida
 
Experience: None
Platform: shoes
Trading: happy
Posts: 6,462 since May 2011

The trifecta for me would be a short at the 786 and the downward inner symmetrical triangle.


Started this thread Reply With Quote
  #599 (permalink)
 
GaryD's Avatar
 GaryD 
Orlando, Florida
 
Experience: None
Platform: shoes
Trading: happy
Posts: 6,462 since May 2011

I am stuck without a trade and reaffirm that it is ok to not be able to decide. Particularly when the market can't either.

Started this thread Reply With Quote
  #600 (permalink)
 greenr 
london/england
 
Experience: Advanced
Platform: Sierra charts, NinjaTrader, VK Trader
Broker: CQG, AMP, VK, Kinetick
Trading: CL/6E/TF/ES
Posts: 952 since Sep 2011
Thanks Given: 562
Thanks Received: 1,280


GaryD View Post
The trifecta for me would be a short at the 786 and the downward inner symmetrical triangle.


Use a 330 Min on a RTH Template

Your levels done look correct :-/


Obvioulsy on a back adjusted contract too

" I will follow my rules, I will take my stops, I will be disciplined and i will work with the market....NOT AGAINST IT! Professional mind control is the key"
Reply With Quote


Last Updated on August 5, 2013


© 2024 NexusFi™, s.a., All Rights Reserved.
Av Ricardo J. Alfaro, Century Tower, Panama City, Panama, Ph: +507 833-9432 (Panama and Intl), +1 888-312-3001 (USA and Canada)
All information is for educational use only and is not investment advice. There is a substantial risk of loss in trading commodity futures, stocks, options and foreign exchange products. Past performance is not indicative of future results.
About Us - Contact Us - Site Rules, Acceptable Use, and Terms and Conditions - Privacy Policy - Downloads - Top
no new posts