Welcome to NexusFi: the best trading community on the planet, with over 150,000 members Sign Up Now for Free
Genuine reviews from real traders, not fake reviews from stealth vendors
Quality education from leading professional traders
We are a friendly, helpful, and positive community
We do not tolerate rude behavior, trolling, or vendors advertising in posts
We are here to help, just let us know what you need
You'll need to register in order to view the content of the threads and start contributing to our community. It's free for basic access, or support us by becoming an Elite Member -- see if you qualify for a discount below.
-- Big Mike, Site Administrator
(If you already have an account, login at the top of the page)
The 22 Days: A Price Action Trader shares his Journey
�Practice does not make perfect. Only perfect practice makes perfect.�
- Vince Lombardi (American Football Coach, 1913-1970)
Over some period of time I will be taking random charts from random periods and would try to take trades .
The advantage would be that I will be able to immediately verify if:
1. my methodology was correct
2. my risk assessment was correct
3. my execution was correct - i.e. stop placement, trailing; target placement, scaling
4. whether I am able to make substantial posts here - whether I can make consistent efforts without lapses.
Dear reader, I am hoping for your feedback - it would be an important component of this journal - pitching away in a lonely field can get a tad monotonous without company.
Getting back into the game now - facing the naked chart and its me and me alone.
Today is 8th Oct 2010. (well, it isn't, but that is where I am on a random chart practicing)
We have:
A clear uptrend.
Price has broken out of the trend channel to the upside.
Seven bars earlier i.e. 30 Sep 2010 there was a double doji break long setup off the 20 EMA which was also a retest of the pinbar earlier.
CHART: NSE:RECLTD Daily - Last day: 08 Oct 2010
How will I trade this?
I am currently flat - arrived too late for the DD break (Bob Volman) and there is a possibility that price will retrace back into the channel.
The spike five bars earlier covered the full height of the channel in the stong bullish move and now a channel is forming.
So my first thought is that I would take no action and sit on my hands.
However since a channel can go on I would get long on the next bar IF following conditions are met next day:
1. the next bar entry is inside the channel and nearer to the bottom of the channel
2. if so I would enter at market and place my stop beneath the bull trendline i.e. the lower line of the channel
3. first target would be the upper line of the channel - the stop for one position would be moved below each prior strong bullish bar.
4. if profitable and first target achieved the stop for the second position would be moved to breakeven, and then trailed as above.
AT THIS POINT: I fast forward and move to the next day which is Monday 11 Oct 2012.
The veil is parted.
I go long at the market open at around 387 without regards to intraday price action and place my stop at 377 (a wide stop - can I do this on live?), my first target at 399, second target not set and then I leave for my day job.
Note to myself: Wondering at this point I should have some NinjaTrader automation - once I am in profit I should have a stop on half my position moved to the last swing low? Would this be optimal (danger of early stopout) or would leaving the stop at breakeven be better?). Practice will lead to the answers.
CHART: NSE:RECLTD Daily - Last day: 08 Oct 2010
Hurrah! I come back to discover first target achieved and a spiky bull bar closing back inside the steeper channel after achieving the first target and which may have given a sweet profit on the second target too.
Some observations and reflections in hindsight:
Given that this is an uptrend long entries will be successful without overt analysis.
What about the second target? It remains an open question. Bullish market that may possibly move much much higher.
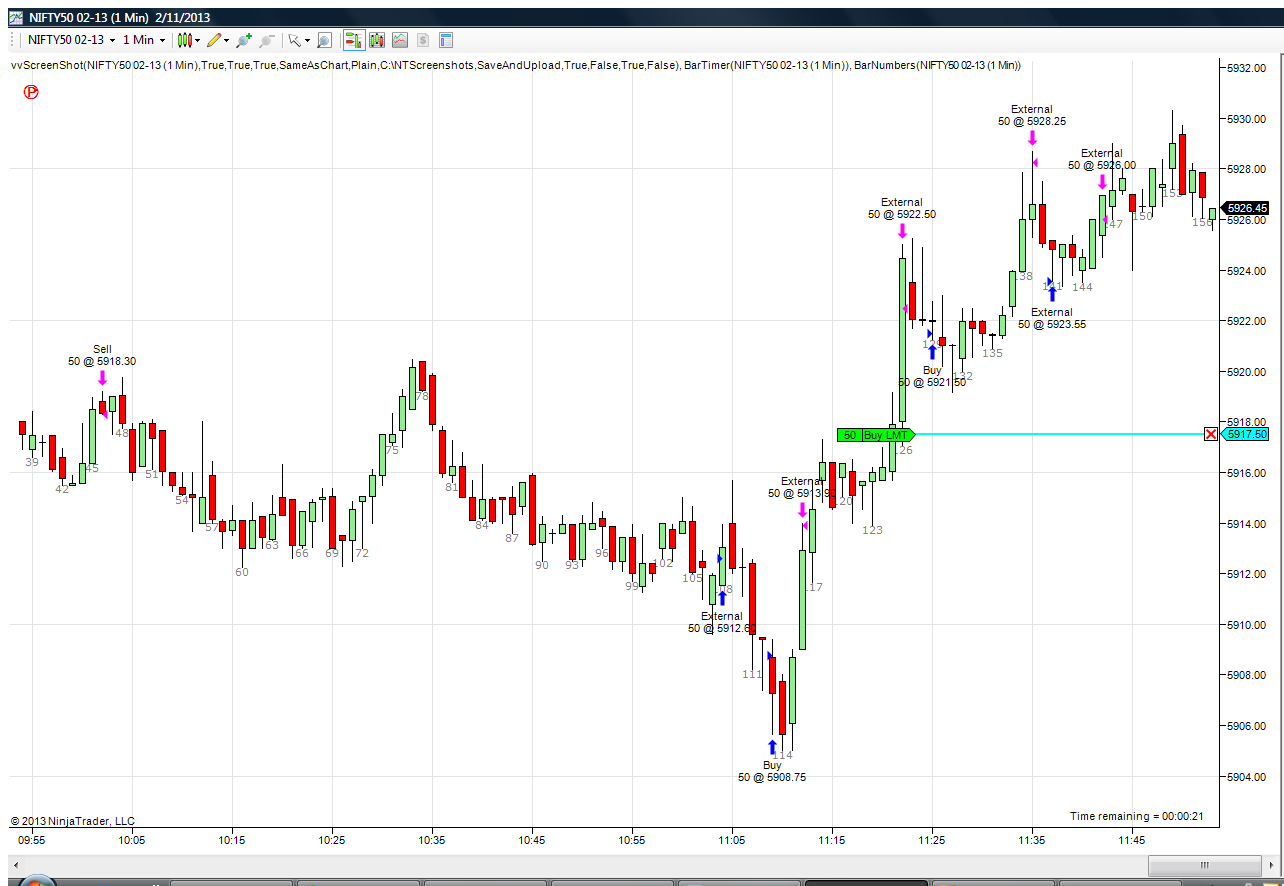
I personally planned to do this in realtime - with the convenience of the vvScreenshot indicator I think I will go ahead and do right that.
I only hope it will not become the Achilles heel distraction for the split second the market does its thing but will definitely be helpful to MYSELF in hindsight. (I do not expect other traders to be tracking me tick by tick when the market is live)
And nach, Its not about guts anymore... I do not post to prove anything to anyone so your sarcasm falls on deaf ears.
I decided to draw a steep trendline and take profits if price touches the trendline.
Let's see how it helps OR perhaps cuts my position short. If it cuts my position short I will be probing myself further.
So before I click to display the next bar here is my current chart with the trendline added:
At this point I am feeling confident and also am elated at my previous profit. Checkpoint. What happens from here would be me and me alone. As @Big Mike says its a mountain of psychology once the base camp of technicals is surmounted.
Earlier I had got such "easy money" from my online endeavors that this seemed worth posting.
I had made money from online surveys.
I had made money in photography contests.
I had got a prize for blogging.
Heck, I had even won a laptop from ebay.in in a lucky draw.
Trading seemed just an extension of the above.
Easy money.
But the truth is that Trading has been the hardest "easy money" I ever made.
Seriously, a professional trader "earns" his money - I woudl say he has to slog more than 10X any other professional.
(Sigh! Now I just realized that there is no free lunch. Sorry for shattering beginner trader dreams, even my own. Let me just say it: Trading is just a day job with flexi hours.)


 if you like to have the valuable feedback from traders, not monday night quarterbacks,
 personally, i would only address you as iq.... K?