Welcome to NexusFi: the best trading community on the planet, with over 150,000 members Sign Up Now for Free
Genuine reviews from real traders, not fake reviews from stealth vendors
Quality education from leading professional traders
We are a friendly, helpful, and positive community
We do not tolerate rude behavior, trolling, or vendors advertising in posts
We are here to help, just let us know what you need
You'll need to register in order to view the content of the threads and start contributing to our community. It's free for basic access, or support us by becoming an Elite Member -- see if you qualify for a discount below.
-- Big Mike, Site Administrator
(If you already have an account, login at the top of the page)
I believe it is important to look a little deeper into the data that is on this (every) COT chart. Even though the Net Short positions of the Large Spec decreased from last week's COT data the actual amount of Short Positions held in OI increased.
Last week's COT data showed Large Spec held 129,889 positions, 47,807 (long) and 82,082 (short).
This week's data shows Large Spec are holding 143,691 positions, 56,771 (long) and 86,920 (short).
This deeper look tells me, of the 13,802 newcontracts entered on Tuesday (4-3-13) 4,838 were entered as shorts, and 8,964 contracts were entered as longs. Although the total number of shorts in OI increased by +4,000 contracts, the overall percentage of longs vs shorts decreased. The inverse is obviously true for the percentage of long positions held in OI.
So what does all this nonsense mean, to Me it means this balancing act between 1.3200 and 1.3000 isn't over yet! This is a range traders dream, while position traders are pulling their hair out.
The first chart below is a VP of of the three days after the COT "snapshot" was taken. The second chart is the entire week.
Before this market breaks out of this trading range I wanted to follow up on the option trading strategy that all this was designed around. If anyone actually read the Carley Garner intro to options that I linked previously, The Nuts and Bolts of Alternative Option Trading the following simplified example will make much more sense.
I chose Carley Garner because she is a fan of selling out of the money options, and that is where this method of reading longer term market sentiment has it's origin. As I said before this line of thought and the necessary posts required to make my point has puzzled me for some time. I want to post it, I'm just finding it very difficult. With that being said, if readers find this topic interesting I highly recommend Carley as the "Go to gal" for a more in depth understanding. It's not that difficult to get your head around but there is risk, and understanding that risk is very important.
This simple system of using the highs and lows of a 20 period average is the core of this analysis. So far in this project "I'm still alive" and survived two, that's (2) with a capital "T" Mario Draghi press conferences!! And two NFP Reports!! And a whole bunch of other reports and news events. IMO, that says something, but what the hell do I know. Tracking OI is as Old School as it gets, when this method was first shown to me the COT data only came out once a month, then every two weeks. We thought we had the market by its tail. Then the COT data came out once a week, what a joy. Today, many people still believe the three day old data is to historic for any meaningful analysis. I like to keep things simple, if readers take anything away from all this OI stuff, take this, If price is rising, volume is rising and OI is rising Bulls have control. If price is falling and volume is rising and OI is rising Bears have control. That is extremely simplified but it will give readers a starting point.
So when price traded above the 20 period ave of the highs and lows, this simple system says price will rise 500 points! Does it work all the time, of course not, but in this example,, so far,, it is! The charts I've posted since the first day define a target, and an exit. At this point the exit locks in over 100 ticks of profit, but it is getting closer and closer to the "action."
The idea of defining the direction of a 500 point move in any market opens many opportunities for traders. This is a simple example of selling out of the money puts (ok, not so far out). When this was first taught to me it was suggested that I sell puts or calls (depending on direction) 500 points away from "the money." Also it was recommended I sell the "NEXT" contract (e.g., if June is trading, sell September puts/calls). For this example, I have data for the June 13 contract. This is a very simple example and I hope it shows the very basics of how all this fits together.
On Monday morning 4-29-13 I continue to believe my analysis of market direction is correct and I decide to sell a June 1.2800 put @ .0050, I place my order and during the day my order is filled. When my order is filled my account reflects the sale and my new account balance is up $650.00. I SOLD 1 @ .0050 ,,, that's 50 6E ticks @ $12.50 a tick,,,, 50 x $12.50 = $650.00. This snip from the CME shows the EOD data for this option highlighted in yellow.
Tuesday the market moves UP, and AWAY from my 1.2800 put and as it does the value of my put drops. This drop in value is my profit, it allows me to "buy back" my put at a much lower price. The market continues to trade near the highs throughout the day and closes above 1.3150, so I decide to hold my put and see if Wednesday's trade might continue to trade higher.
Wednesday when price is trading above 1.3200 I enter an order to buy back my 1.2800 put @ .0025 an lock in 25 6E ticks of profit, my order is filled and my position is flat. After the order is filled my account reflects the transaction and the balance of my account decreases $325.00 leaving me with 50% of the original sale price of the put, or $325.00. The snip below shows the EOD data for the 1.2800 put highlighted in yellow.
For those who have no knowledge of options, this is a very simple example of selling a put at a high price and buying it back at a lower price. The same idea can be used in reverse, sell a call when the future's price is trading high (above 1.3200) and buying it back at a lower price when the future's price is trading lower (below 1.3100). Options can be a great way to manage risk when trading longer term (holding positions overnight). They can also aid in controlling risk intraday. Once again I'll recommend Carley's website for anyone who seeks more information on options. Simple, always seems to work best for me, options offer that. The option strategies can seem complex and foreign but they don't have to be. The simple strategy in this basic example could have been implemented dozens of times in this range bound market (6E) over the past several weeks, and I'm sure it has been by many traders. I hope I presented this in a simple and understandable fashion, writing this has haunted me for weeks!
At some level I have to believe in J. Peter Steidlmayer's theory that, "Time is missing in today's markets." Hesitating and waiting for "confirmation" can (IMO), mean the difference between a great trade and a questionable trade. When price has the ability to travel in either direction at speeds restrained only by the speed of electrons passing through a cable, I have to realize my "best analysis" at the tick level is always vulnerable. I read an article lately about HFT Systems and their complexity. The take away of the article was even though the more complex systems which required more calculations were very profitable in testing, the actual results in live trading was much worst. The reason for the poor results of these systems was the time it took the computer to do the complex calculations. I found this article most fascinating, in theory the system that calculates 2+2=4 is faster than the system that calculates 1+1+1+1=4, hence, it wins the HFT game! So what does all this mean to a retail trader trying to snag 10 ticks out of the 6E? To me it means the environment in which we (I) am trading has the ability to move price faster than I'm humanly capable to respond to! The bottom line for me is, have resting stops in the market when ever I have an open position, it ain't perfect but it's the best I can do to protect my trading capital form an adverse move that can literally happen in a blink of an eye.
The average length of a blink is 100-400 milliseconds. Closures in excess of 1000 ms were defined as microsleeps.
Not much market moving news on the docket this week and the daily volume numbers suggest the same. Some traders out on Holiday as well and when any morsel of data crossed the wire a blip within the range appeared. Price levels do draw volume and I believe this is reflected in the volume above 1.3150. IMO, the 1.3250 level remains in play albeit the propellant to get price there is a mystery to me, but pain is always a great market mover. When I started this project I sure didn't think this market would attempt to "go for the record," of the longest sideways consolidation in the history of the instrument, good grief! I say this because my OI chart is getting out of hand, I hope those who are actually following this project continue to do so despite this "busy chart." The preliminary data this morning shows a big increase of OI and if this number holds, exceeds the twenty period average. This increase in OI also competes for the highest OI reading in this sideways market by a few thousand contracts. What I believe is noticeable is this increase is on the fourth day of higher lows, but as I type this these "higher lows" may be in jeopardy, time will tell. So far the OI on "snapshot" day was the lowest for the week, and also the tightest range of the week, a tough call for sure. Here are the charts and a few more to show how compressed this trading range has become. I added a simple indicator to the Ave Chart, it is charting the spread between the 50 sma and the 100 sma,,, nothing earth shattering here but I did notice Yesterday was the first day this spread didn't expand (yellow circle), I just wanted to keep an eye on it.
This morning a dump truck down the street was unloading some dirt and got its bed caught up in the power lines. My battery back up kicked in and I had to shut everything down. I'm back up and running and wanted to make my final public COT Call and bring this project to a close. Yes, the big Dollar move yesterday triggered the signal to exit the Long position that was signaled on 4-05-13. This system is OLD, it's based on EOD charts of the PIT Session before the Globex system went online. So there are some quirks to it that I've smoothed over. The original system says (this is for exits) if price closes below the ave of the 20 period lows, exit on the Open the following day. So in today's market with 23 hours of trading, this gets a little "gray," should I use the LAST or the SETTLE. Since I don't trade this as a system, and only use it for longer term analysis I use the settle. I actually posted a hand written (original) copy of this system up-thread if anyone really cares. There's a "filter" for taking entries involved that I didn't write about in these posts, just to keep things simple. I did trade this system for a few years, combined with option positions and I did OK, but the swings in these longer term positions just didn't fit my "style," and I began to take pieces out of the middle of these moves. Later as the "online trading" thing, caught on I became much more short term oriented, and I continue to be. One last line of thought before I put this project to bed. The whole idea of reading longer term charts as a tool to benefit intraday trading is "Poo Pooed" by many traders, the arguments pro and con are many and I understand them all. This longer term analysis works for me, and that's what's important, we all must find our own way. After studying the movements of price while trading this system I began to incorporate the work of other traders, Dunnigan, Arms, Belveal, Angell, Steidlmayer and many more all played a part in forming the method I use for short term trading today. The point is, there are hundreds of traders that came before us, we (I) don't have to reinvent the wheel to find a method or combination of methods to fit our personal trading style or trading psychology. The study of daily charts and the work of these "Old School" traders just might stimulate ideas that can be used profitably on much smaller time frames while keeping the theories of their original work at your back.
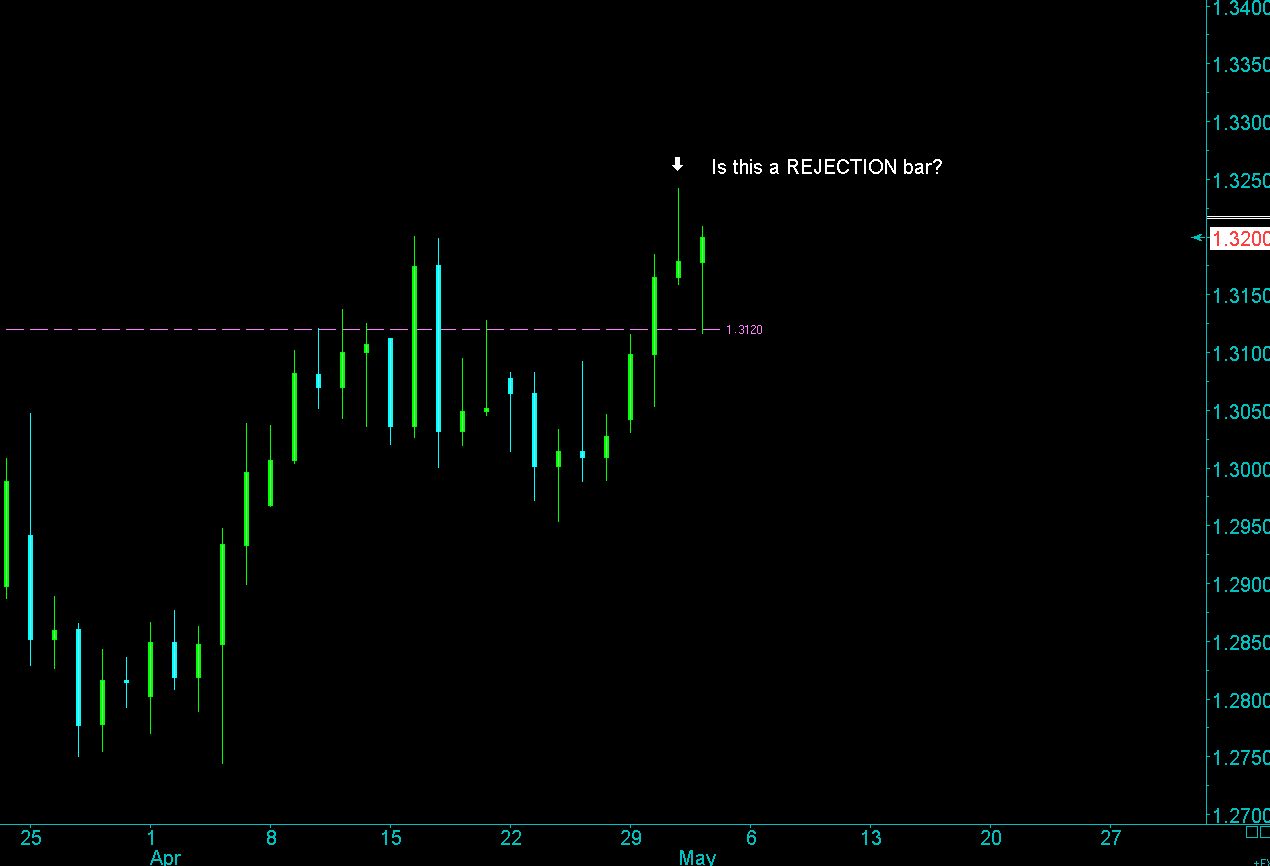
Here are the (final) charts of this long term project, however I will post the COT chart when it's available, hopefully later today. I posted this first chart in the chatbox during the ECB Rate Cut (it's a daily), the low of this (rejection?) bar @ '65 stopped the NFP "rally" (high '64) cold the next day (Friday).
The whole idea of tracking OI is to NOT get caught on the wrong side of the market when the Large Spec "switch sides." Monday was marked by Holiday trade and Tuesday, the "snapshot" day could be argued as the thirdinside day since the Thursday ECB rate cut. I believe this weeks COT data could go either way but given the steady rise in OI from Friday's low reading I have to go with another decrease in the Large Spec Net Short positions.
I figured the Longs would have stuck around for one more day, but I guess not. The COT data shows Large Spec are now Net Short -33,533, an increase from last week.
I just can't let this one go by. While doing my numbers I noticed this Huge increase in the preliminary OI data during Friday's trade, almost 9,000 contracts! My wife is going to kill me in about 15 minutes so this is going to be quick. This big increase in OI and the fact price came up off the lows during the U.S. Session has me believing this Big Long Extended Consolidation period between 1.2950 and 1.3250 isn't over quite yet. Another reason I have for questioning if this down move can continue is the two sell days I marked on the chart below. I marked these charts with two lines that I believe will be/could be the Anticipated Range for Monday's trade. Using the close of minute bars for the Trend Reaction Numbers (S/R Pivot), price splits the difference perfectly. Will price rise or fall off the Pivot when trading begins in a few hours, I don't know but I believe these two (marked) levels will offer further confirmation of direction. If you guys are as passionate about this stuff as I am, I'm sure you understand why I've returned to post this. I haven't checked for (weekend) news but this coming week is another busy "High Tier" report week for sure. Just for shits and grins, remember, the 20/20 system says, "If NOT profitable in four days, close the position." In short, I believe if these levels give way, it's game on for the Bears at 1.2915 and if price trades above 1.3041 the Bulls are back in this thing, in force, I have to add with these OI numbers. Well here it is, at 5 pm tomorrow the riddle will be solved, happy trading.
No, my wife didn't kill me last week. Maybe she was a little more forgiving than usual since it was Mother's Day . I posted this chart (first chart) on Sunday afternoon watching these two levels to confirm direction. Monday's trade was another balance day and price went no where. Tuesday (second chart), price reached up for 1.3041 during the Asian and European sessions but came up 9 ticks short and began to trade lower. The down trend continued after the European close and at the close of the U.S. session price traded thru the 1.2915 level. IMO, at that level it was "game on" for the Bears.
I think this is going to be an interesting post, my intention is to show that a Volume Profile chart doesn't show anything you can't see on a regular bar chart. I've been thinking of putting this together for awhile and finally got some free time. I've been noticing traders in other threads struggling with their trading and some of them, I believe, are putting way to much emphasis on the patterns generated by their VP study and VWAP levels. If anyone actually took the time and read this thread they would probably (without much effort) find many contradictory statements. I might say one thing in one post and turn around several posts later and say something that seems totally opposite. The "catch all" phrase is context.Context is hard to argue with, was it an up day or down day, a trend day or range day, was there news coming out or did news just come out,,, get the picture. Context covers a lot of ground, and I believe many "vendors" as well as traders are not above the use of the term to, cover their butts. IMO, when the teacher says things like, "You have to use it or put it in context," the student is left far behind the eight ball, scratching his/her head wondering and uttering to him/herself, "What the hell did he just say?"
I believe there are two things that need to be agreed upon before going forward. First, everything, did I make that plain enough, everything that is painted on my chart whether it is a bar, candle, indicator line, number in a footprint box or standard deviation line it is all generated from historical data. If the last tick was a 5 lot trade, that tick is now the past! The second thing that needs to be agreed upon may be a bit more controversial so I'm going to quote James Dalton, if you don't know who he is stop reading, google his name and come back to this thread later. The quote by Jim Dalton about Market Profile, "It (MP) doesn't tell you to buy or sell or anything else. It is just a way to organize data. It gives you depth." I know, I know, he's talking about Market Profile and not Volume Profile, I believe that's a weak argument. VP was originated as a way to circumvent the strangle hold the CBOT has on MP and its intentional use was that of MP, it still is, "It is just a way to organize data." Most software programs list the VP study as a volume histogram, it simply charts historic volumes of trades on price or of course time on price. I believe this is where the controversy lays, traders think VP which has become more granular (due to the availability of T&S data) than MP it (VP) is more than what it really is, simply, "a way to organize data."
I've made many posts in this thread stating I'm buying or selling this LVA that HVA or the POC or the POC of yesterday. But there is one thing that I take for granted and that is context, this post is an attempt to define context and show the true function of the VP study. Lets rock and roll.
I operate under the notion of three trading sessions Asia, EU and US, each have their own characteristics and I believe if traders study each of these sessions and understand them on their own merits, trading opportunities exist almost around the clock. This first chart shows a profile and VWAP at 1:55 am on Friday. Any trader worth his salt ought to be able to see why the histogram is shaped the way it is, most of the trading is near the lows (the bars show that) and the histogram (VP) verifies it by, "organizing the data." If anyone has read through this thread they may have come upon the 2 am reversion to mean trade that I wrote about, that's what I'm looking for at this moment. This is the hard right edge of the trading day and that last bar is dropping below the lows of the last hour or so. But to find the context I have to look back and see where price came from. When I look at this chart which began charting at the Globex open I see a High just above 1.2890 and a Low just above 1.2855,,,, The question of all traders should be, why? Why did price stop where it did on both of these extremes, at this point the trading range is +/- 30 ticks, the average range is 100 so it is safe to assume this range will expand. As a trader if I can understand the range as it is right now I may find opportunities to trade in the future.
By looking back in this chart, I get a whole different perspective. For the past two days price has traded on these same levels. It doesn't take long to realize price has traded continually in this same 30 tick range for more than 40 of the last 48 hours. If I had left the VP on these past days where would you assume the POCs were? Wednesday's is on "60 and Thursday's is on "75. Basically today's POC splits the two previous days. The point I want to make here is, how accurate do you need to be to make a trading decision?
This chart is an hour later, the London open. Price expanded the range by a few ticks to the down side and has returned to the safety the high volume area. I added lines at the highs to show where resistance might be expected if price tests this extreme of the range.
My hope is readers are noticing price is testing price and the VP is charting that movement. Price is not testing the extremes of the VP. The VP is charting the historical movement of price. Does the VP represent the prior price movements, of course, but the true support and resistance levels are prices. I believe this is an important distinction, why, because traders tend to get all wrapped up in the VP and fail to remember what is just under the skin of this "indicator" price. IMO, the two most important levels on a chart are yesterday's high and yesterday's low. How price trades on those levels today is much more important than a SD band generated by the VWAP. I think this chart is a good example of price testing price at the highs. The VWAP and the VP are "cut from the same cloth" and it is not by coincidence that the +2 and -2 SD levels often align with the VP levels, the point is these indicators are generated from past data and that is in fact what they chart.
One last chart. We all know what happened here, but I believe this is where longer term analysis is helpful. When this session started I had three numbers to the down side and three for the up side. The top of this range held and the bottom didn't.
Getting back to the basics of intra-day trading to me, means keeping things simple. These simple numbers and their calculations have been a mainstay of my trading for many years, why, because I believe they offer me opportunity. Traders describe these numbers in many ways, I use the definition of Trend Reaction Numbers, a spin off of Welles Wilder's work in his Reaction Trend System outlined in his (great) book, New Concepts in Technical Trading Systems. I recommend this book to anyone seeking a deeper understanding of these numbers, the principles behind them and his many avant-garde contributions to technical trading. IMO, New Concepts in Technical Trading Systems should be on every traders bookshelf. Just my opinion of course, but he is and will remain a legend in technical trading.
This first chart shows these numbers plotted on daily bars over the past week and even the most pessimistic technical trader might be tempted to believe there's something there. Since these numbers are calculated only from price I would assume they would work equally as well in the Spot Market. I've said many times this thread is about the 6E, I have no idea how these principles relate to other markets. Probably, the first argument would be, "Who's willing to ride out the intraday price rotations and trade these numbers?" Although that is an honest and valid concern, it reveals a misunderstanding of what these numbers are and how they're to be used for trading.
It's no secret the TR (trend reaction) numbers ain't the only game in town, when trading the 6E. On most any given day, the 5,10 and 20 day average ranges will tell me there are over 100 price levels that get traded intraday, the TR numbers identify three (3) of these levels. Two other significant price levels I watch are the previous day's High and previous day's Low. The two charts below show me that these levels deserve my attention when trading intraday. Since the TR numbers are in fact a derivative of the previous day's High and Low, I believe this augments the value of their importance.
Another piece of the puzzle is how price responds to whole numbers (50's and 00's{even}). Whole numbers often "bracket the range" when looking at longer term charts and often play an important role in my intraday trades, especially the rotations around these levels on shorter term time frames.
This chart puts it all together (and then some). I've extended the previous Highs and Lows to the right to show how they become areas of interest when referenced to the TR numbers. This chart shows two (2) Sell #s, (2) Pivot #s and (2) Buy #s on each bar which are simply averages of averages. The area between these two (2) numbers creates and area where I believe price "should" stop and reverse direction. If readers look closely at the far right bar they may notice two (2) additional "white lines" near the sell numbers and two white lines near the buy numbers. These are the averages, that are used to create the "average" that is the levels marked as the "fuzzy" TR numbers. The idea is, price will consolidate in the "area" of these buy/sell ranges and then move to the other end of the range and consolidate in the "area" of the other buy/sell range. This chart shows this anticipated price movement occurred on three (3) of the last 5 trading days. Monday's and Friday's range was confined within the Pivot and one side of the anticipated rage.
No Rocket Science here, just some Old School number crunching. IMO,,, Whole numbers, the previous day's highs and lows and the trend reaction numbers combined with a "common sense" risk management plan and an understanding of basic price action trading can provide discretionary traders with many trading opportunities during any of the three trading sessions, (Asian, European and U.S.) day after day. I hope I made one point clear, the TR numbers are not stand alone levels to initiate trades. IMO,, They (TR numbers), signify "an area" in the market where trading "may occur" and it is up to me to evaluate the possibilities before initiating any trades in this predefined area.


 With that being said, if readers find this topic interesting I highly recommend Carley as the "Go to gal" for a more in depth understanding. It's not that difficult to get your head around but there is risk, and understanding that risk is very important.