Welcome to NexusFi: the best trading community on the planet, with over 150,000 members Sign Up Now for Free
Genuine reviews from real traders, not fake reviews from stealth vendors
Quality education from leading professional traders
We are a friendly, helpful, and positive community
We do not tolerate rude behavior, trolling, or vendors advertising in posts
We are here to help, just let us know what you need
You'll need to register in order to view the content of the threads and start contributing to our community. It's free for basic access, or support us by becoming an Elite Member -- see if you qualify for a discount below.
-- Big Mike, Site Administrator
(If you already have an account, login at the top of the page)
I think there are traders out there that can be given any random price and with the right direction, adequately placed stop, and target(s) can consistently make money risking the same amount on each trade despite where the entry is located. Some trades will take longer than others considering the stop and targets could be located farther than usual. You're right, not everyone can do that because trading size and time in the trade will be constraints to the average retail trader. So, the entry on or near whatever line is meaningless if the other factors of the trade aren't defined(how the trader exits). Many of these factors are not even related to the initial point of entry either.
R.I.P. Joseph Bach (Itchymoku), 1987-2018.
Please visit this thread for more information.
I should note that the point, if there is one, of the "Random Line Theory" has absolutely nothing to do with lines.
It was just illustrated with lines, which are easy to draw at random locations. The same point could be made with respect to any methodology, although it might be hard to make it as simply as with just a bunch of lines....
What you are saying, that some traders could make money with almost no criteria other than the most basic ones, is very much in tune with the whole point: that it's the trader as much as (or more than) the methodology that matters.
This is an interesting topic and one integral to my trading. I have spent much time trying to develop signals I would truely believe in and ones I thought could make money across different markets and time frames. I must say that I have not been able to crack this the way I would like despite looking at the problem from both a simple (indicators) and more complex basis (geometry). What I did find worked best for me was visually applying trend lines geometrically positioned to find trading signals. So I was initially disillusioned to read this thread and to realise that the basis of my trading is based on signals that could potentially be random.
Then on further reflection I would make the following comments;
1. I hate to say this but I don't think these lines are that random as these lines seem to be placed thru previous highs and lows and for me this is how I seek to place these lines.
2. The most difficult part of trading always comes back to how to interpret the chart, taking the trade and then money management. This is more important and given as previously stated by @bobwest, with 52bn different indicators it can't just be about the indicator but more about how the trade is managed
3. Lastly given that some believe the markets are a random walk yet a select few are able to extract sizable returns tells me that despite the randomness, we can still find profitable means to extract profits. This may or may not be trend lines but if it were these trend lines then, I would that over time your bank account will tell you if you are adding value looking at them or not.
Recently i've received an email about this thread and it was the same time i've posted something similar on my own blog. Yes, i have something to say about this "randomness" guys. Hehe...
When i was in army i've dealed with some encrypted communication channels and there was a device wich sort incoming messages and filter out the spam ones.
So what is the market spam and how could we filter out it to find the true message? Is it ever possible?
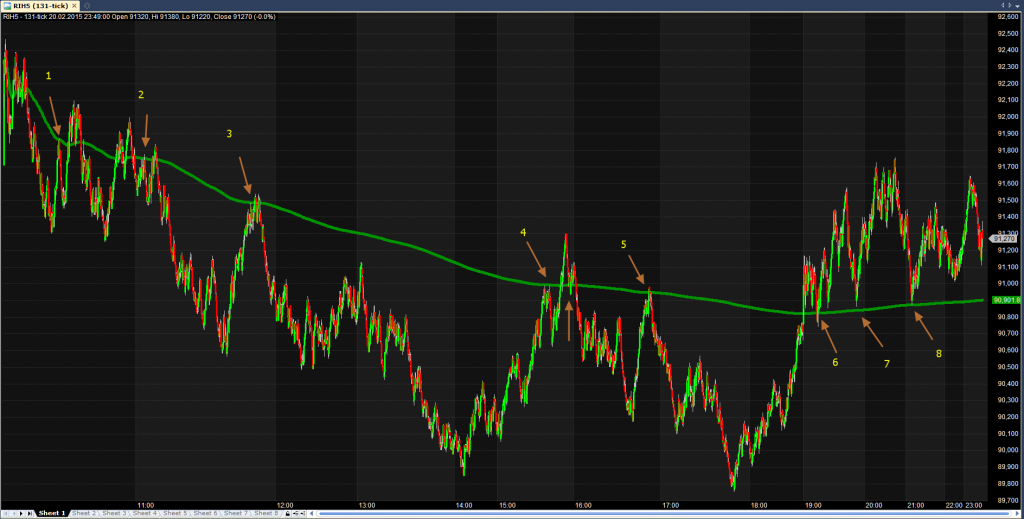
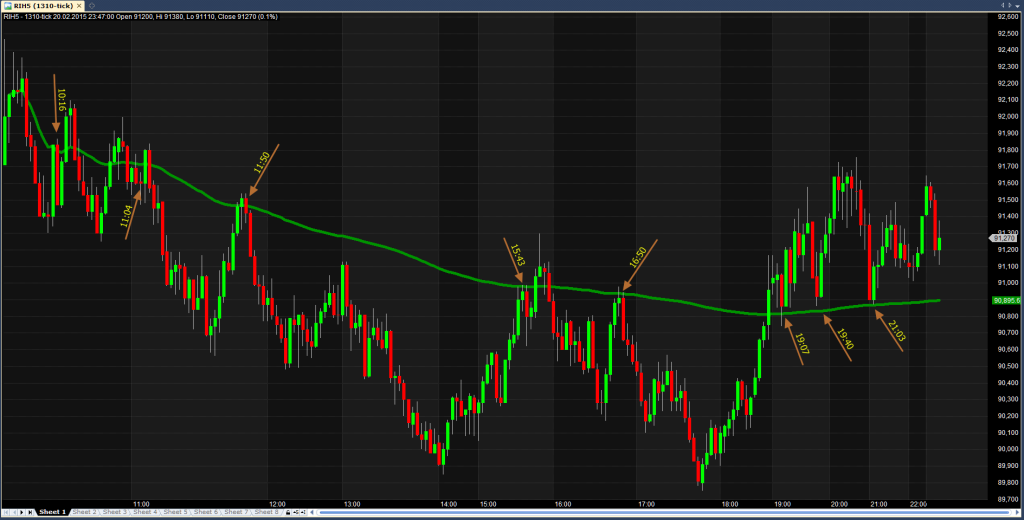
Lets look at theese two charts of russian RTS future:
First picture is 131 tick. Green moving average line is the filter.
I've marked places where were some reaction to price that was equal to green line at the same time.
Then, i've remember the times where such reactions appeared.
The second picture is the same market, same day, same average line but 1310 tick timeframe. (10 times of first one)
Regardless of used timeframe, regardless of differend data source (closing prices of 1310 tick and closing prices of 131 tick candles not the same one) the line marked THE SAME price level on all timeframes.
@growex I dont think your post has anything to do with randomness. You are using a mathematically plotted moving average that will be positioned at the same levels no matter what chart you bring up.
The point of the thread is the fact you can close your eyes and manually draw a line on your chart and there is a good chance that the market will use your level as resistance. The odd's are it will work just as well as a moving average or a trend line. So what we learnt from this is you should never rely solely on moving averages or trend lines for any kind of consistency.
The point of the thread is not that everything is random. It's easy to misunderstand that, but if you do, then there's no value to the thread at all.... after all, not everything is random.
The point is that if you deliberately generate actual random lines, they will appear, much of the time, to look like meaningful, usable levels that price is reacting to. Of course, price is not reacting to those lines at all, since they were just put in by a random number generator that didn't know anything about price. Therefore, the apparent meaningfulness of these lines does not come from the lines at all, but from the mind of the person seeing them, who is finding patterns even though there are none, or none that can be relied on in trading.
This does not mean that you can reverse the logic and conclude that "all" levels that price seems to react to are random. That would be a simple logic error. And it is not what is being said here.
What is being said is that even when we know that the levels (or other indicators) are both meaningful and useful in trading, some of the meaning that is found in them comes also from the pattern-recognizing action of the mind, as much as from the lines on the chart. Which means that, if a particular method is working for someone, some of that is due to the way that he is putting it to use, which is in him, not in the method. Likewise, if a trader is having difficulty in trading, searching for another, better method may not be of much help, because the issue may be his, not his method's.
So, a part of the success of any tool is in the use of the tool. That's actually very obvious.
The random lines just make the action of the mind in interpreting the chart more evident, because the perceived meaning cannot, in this case, be coming from the lines themselves.
I hope I've made this more clear. For me, it was a matter of not seeing the point for a long time, and then suddenly saying, "Oh, yeah, now I get it...."
Actually no matter what kind of lines we are using, horizontal lines or moving averages of some period...all of its will fit under described theory of random lines....This line does too but at the same time it has property that is robust.
Let me describe how it is constructed...it has no moving window at all...it does averaging all datapoints by its full amount.
For example at point 1 it is equal to sma(1), at point2 = sma(2), at point3 = sma(3).....etc
Simply build such line on your charts....mark turning points on say 3minute timeframe and switch the timeframe to 15 min. You will see what i mean.
It may be an interesting mean but look carefully - there is no information carried in the line - price is just as likely to continue through it as it is to reverse from it. That is true of all bands/averages or whatever, people attribute information where there is none. For example VWAP is often held in high regard by those who disparage many other lines, yet it is no different - useful for mean reversion, but no saint.
edit: Just thought of an illustration - picture in mind a worst case range day where price basically tracks a sine wave of one hour period - how many times will it reverse instead of going through?
You're absolutely right.
Imo the one and only goal of technical analysis is to find when the traders decision are the same. Everything we have is just our brain and our strategy. When i see the same thing happening at the same time at the same price and near the same line it will be much easier to make my final decision.
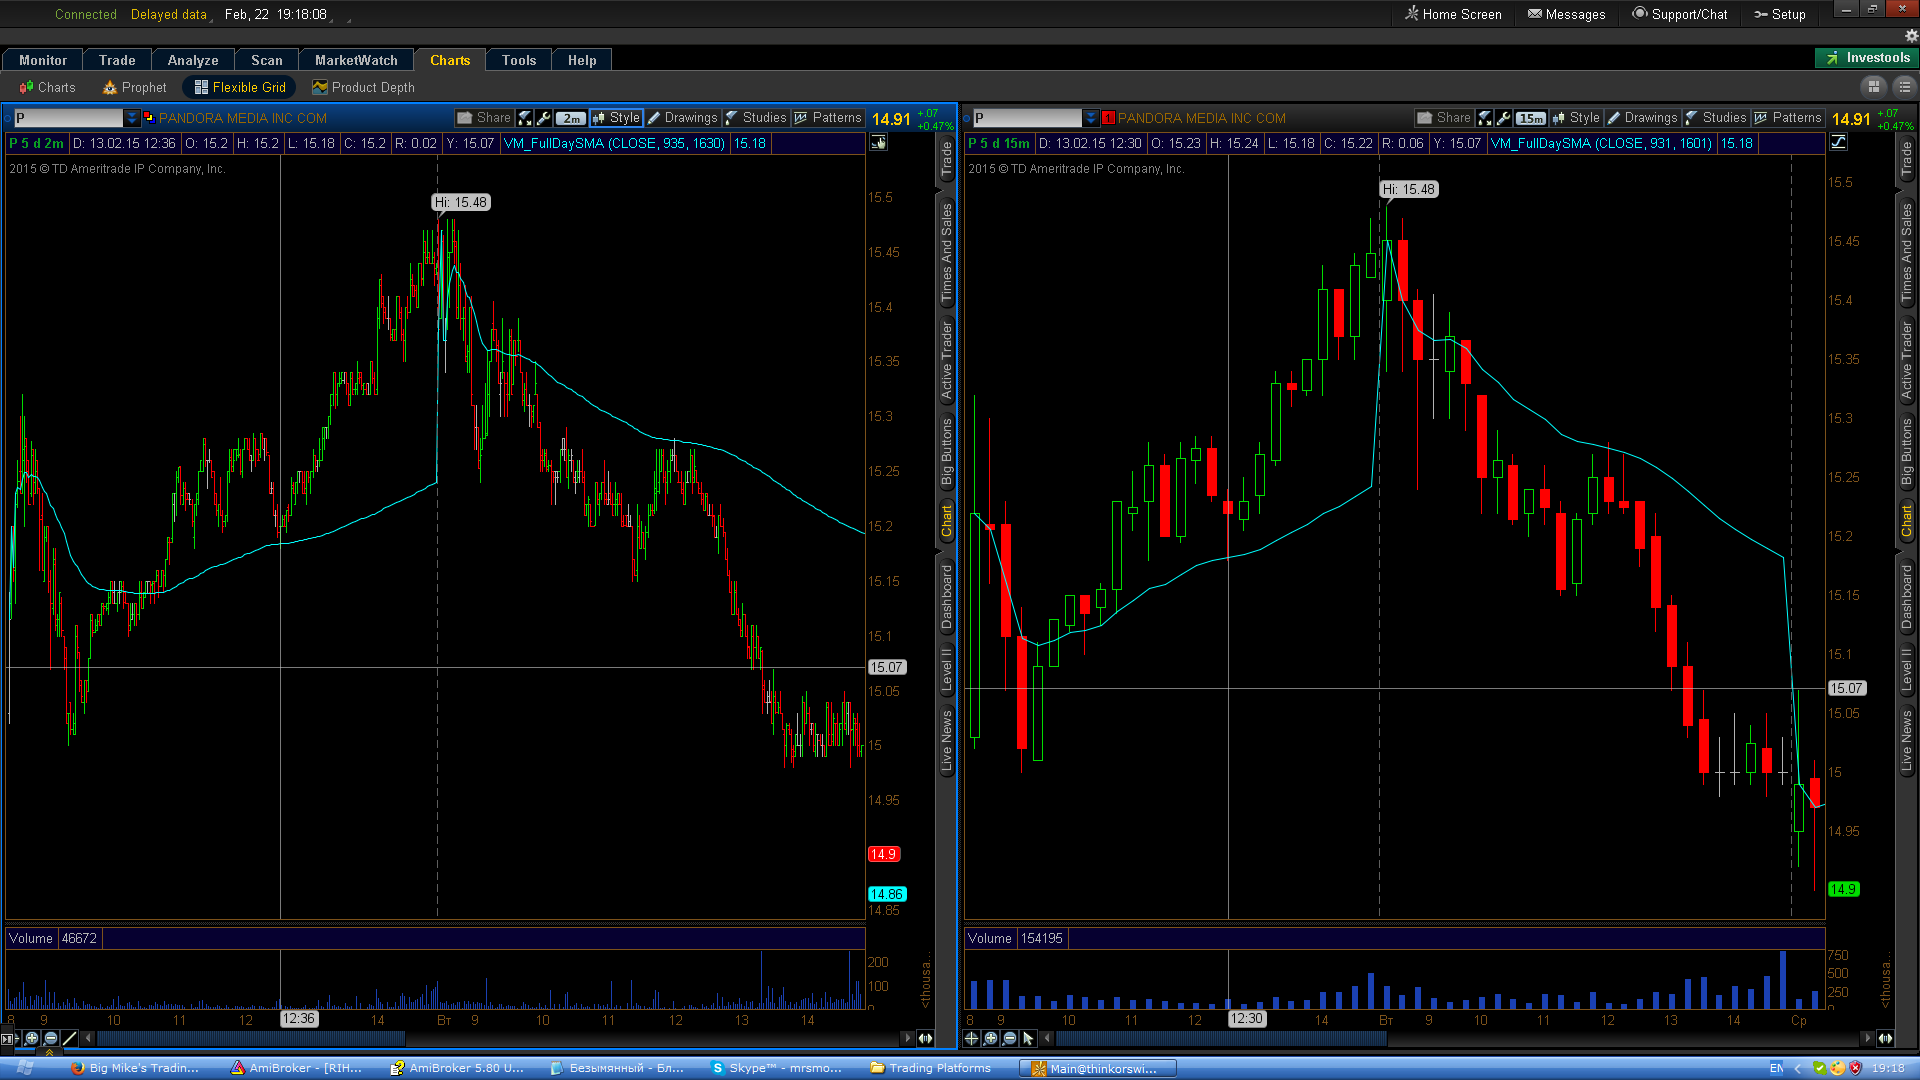
Here's one more example
2 min and 15min charts of Pandora. The cursor positions on both charts are synchronized in time.
The next day you can also see the turning point near the line. At the same time on both timeframes.
The line itself means absolutely nothing but it is that duck and fish i've found in sky clouds....