Welcome to NexusFi: the best trading community on the planet, with over 150,000 members Sign Up Now for Free
Genuine reviews from real traders, not fake reviews from stealth vendors
Quality education from leading professional traders
We are a friendly, helpful, and positive community
We do not tolerate rude behavior, trolling, or vendors advertising in posts
We are here to help, just let us know what you need
You'll need to register in order to view the content of the threads and start contributing to our community. It's free for basic access, or support us by becoming an Elite Member -- see if you qualify for a discount below.
-- Big Mike, Site Administrator
(If you already have an account, login at the top of the page)
no you have to pay- its like 100Dollars or something like this to join and get access to all the vids, I have never done it, but some of the guys at VSA Forum (Private Volume Spread Forum check it out here: VSA Forum • Index page) swear by them... Each to thier own.
Side note I recommend you join if you want to learn some VSA
There is a substantial risk of loss in trading commodity futures and options. Past performance is not indicative of future results. The opinions expressed here are those of Gary Fullett, and are not to be taken as a recommendation to buy or sell commodity futures or options. This is for educational purposes only.
Any stock that is under $5 is a VERY speculative stock, and probably has little or no earnings. Thus subjected to a lot of manipulation. I would suggest staying away from those stocks. They tend to be stocks that have too much risk, even though the risk is just over one dollar. I really can't comment on the chart because I don't think those types of stocks are worth your money and time. Once in a while, a stock like this will do well, but the odds don't favor it.
Regarding BAC, a buying climax occurs when a stock is in an UPTREND. Since BAC is in a downtrend, this can not be a buying climax. What you saw at that area was stopping action in a downtrend by strong hands selling into the rally. The buying climax is a process in which a trend goes from up to down.
BAC is one of the poorest performing stocks in a relatively weak sector. If you want to be in the banking sector, there are stocks that are better positioned than BAC such as JP Morgan and Wells Fargo, and many regional banks. Wyckoff always wanted to buy the strongest stock in the strongest sector and BAC doesn't meet that criteria.
Please don't take this as any negativity to your charts. I'm just trying to use proper Wyckoff terminology to the charts you presented.
Gary
There is a substantial risk of loss in trading commodity futures and options. Past performance is not indicative of future results. The opinions expressed here are those of Gary Fullett, and are not to be taken as a recommendation to buy or sell commodity futures or options. This is for educational purposes only.
Gary, thanks a lot for your comments. Would you please take a look at these two stocks? First one is MMT.V (Canada). I find it hard to tell if we are in a distribution stage since Feburary 2012, or this is re-accumulation.
From the daily chart, the price pattern since Feb. looks like a contracting triangle. On April 3rd, it tries to break above 1.1 but closed right at 1.1. now it is approaching 1.1 again, but volume is getting lower. I am a newbie here, but I guess this would mean that we are more likely to go down than breaking 1.1 and going up?
Mart Resources Inc.: CVE:MMT quotes & news - Google Finance
Another one I am watching is BAC. We had buying climax on March 19 and topped at 10.10, and now we are heading down. This week is sideways slightly up, and volume decreasing sharply, so I guess this is clearer than MMT, and it looks more like a re-distribition week this week?
Bank of America Corp: NYSE:BAC quotes & news - Google Finance
Thank you Gary. I have been doing value investing for over 3 years, and as I recently come across Wyckoff, I think it is great to combine these two together. I am fully aware of your comments above for these two stocks, but since I have done a lot of fundamental research into these two stocks, I think they are solid.
Could you please comment in terms of Wyckoff volume analysis, and let me know if they look negative?
MMT is in a contracting triangle with decreasing volume.
BAC was in a solid down trend in the entire 2011, but it bottomed out in November, and bounced back up. Is there a way to know if the bounce from $5 to $10 is a dead cat bounce, or we could know that the accumulation has completed and we are heading up now?
As far as the "pattern" that you see, you could well be right. But unfortunately, due to the low price of the stock, it has much less validity due to the increased probablity of manipulation on a lower priced stock like this. Because several million shares can sway that stock a decent percentage. This is what they consider in the industry as a "pump and dump" situation. I'm not saying this particular stock is a candidate for this, but these types of stocks tend to have that characteristic.
BAC stock, at one point, was about $56. So when the stock went to $4 in a matter of several years, this technical damage to the stock is not easily rectified. At the very least, the stock would have to get above $the $20 area, to me, to be considered positive. I think this stock is going nowhere for many years, and it will form some type of trading range due to the massive break. There was a reason for this stock to lose almost all it's value. So if there is to be an accumulation phase, it will take a long time to develop. In the mean time, my best advice would be to look for the edges of the market at important swing highs and swing lows to trade. It is true that the stock "doubled" in price, but you have to consider the whole story as it almost lost 100% of it's value. Again, this is a weak stock in a sector that has not performed well.
Gary
There is a substantial risk of loss in trading commodity futures and options. Past performance is not indicative of future results. The opinions expressed here are those of Gary Fullett, and are not to be taken as a recommendation to buy or sell commodity futures or options. This is for educational purposes only.
Thank you Gary. I am trying to combine value investing with wyckoff method, and solve my problem of when to buy. The problem with value investing is that after doing all the fundamental research and determine the stock is deeply undervalued, I still don't know if I should buy now, or I had better wait for a few months.
Wyckoff methods will be able to help me on that and tell me if there is a high probability that the stock may fall further in the intermediate term so I could wait for a better price to get in.
I have done extensive research on the banking sector and I believe it will come back in 2 years. Also I know a number of billionaire investors buying bank stocks, such as Wilbur Ross.
From volume analysis and if you just look at the chart for the near term, it does look like price will fall further, right?
Regarding a contracting triangle, if we see volume decreasing sharply as it approaches the end of the triangle, what can we say about it? (Let's assume this is a highly traded decent stock instead of a penny stock) I just want to learn more about how this works theoratically.
One of the "bibles" of technical trading is by McGee. In that book, they have many "patterns" that show which way a move will most likely go. In the case of a triangle, the breakout tends to be in the direction of trend. In Wyckoff, we use horizontal lines to tell us support and resistance and demand and supply. So in a stock, you would want to buy it if the trend of the stock is at horizontal support in an UPTREND. Conversely, you would want to sell the horizontal line at resistance in a DOWNTREND. So in my eyes, I don't look at it as a triangle, but as horizontal support and resistance. If you feel the stock is undervalued and it's a $1 stock, your risk is nominal. Many times, the technical picture will lead the fundamental analysis and, in this case, if the technical analysis is poor and fundamental analysis is strong, that points to, in my mind, weakness and not strength because it appears to be a red flag. A stock or commodity is only worth what people are willing to pay for it. At this point, the stock is what it is. So traders feel the value is where is where it's trading at. Please remember, stocks tend to see things 3-6 months in advance.
Gary
There is a substantial risk of loss in trading commodity futures and options. Past performance is not indicative of future results. The opinions expressed here are those of Gary Fullett, and are not to be taken as a recommendation to buy or sell commodity futures or options. This is for educational purposes only.
Gary, thanks a lot for your comments. I think this is getting interesting.
For stocks, I think the market cap is more important than the share price. If the market cap is large, it is impossible to manipulate even if the share price is $1. For example, if MSFT announces a 1:33 split, per share price will be less than $1, but does this mean some random person can manipulate it? Clearly not. MMT's market cap is over 300 M, so I think it is probably hard to manipulate. Usually how small is the market cap do you think can be easily manipulated?
Looking at BAC's monthly chart, the first chart is the run up to $56 high. Is there any clue that is the top to get out? The previous two years of volume seems steady each month.
The second chart is the run down and stablizing after making the $56 high. We somewhat formed a double bottom in 2009 and in 2011, and each bottom's volume is much higher than the average time. The most recent month is a down month, but volume is low. Does this mean anything? Wyckoff's method says if the trend is down, ideally all the down bars should have high volume and all the up bars should have lower volume, but sometimes I do see a trend going steadily with low volume, but just keep going in that direction, such as the entire 2011 for BAC, or the recent surge in ES from December 2011 to now.
Gary, any updates on the ES?
The volume is lower than yesterday and price didn't move too much higher than yesterday's high. Weekly shows a close above last week's high but volume is lower. I guess for wyckoff methods, it will be more significant if volume is high but price didn't move too far, compared with volume is light but price moved relatively far?
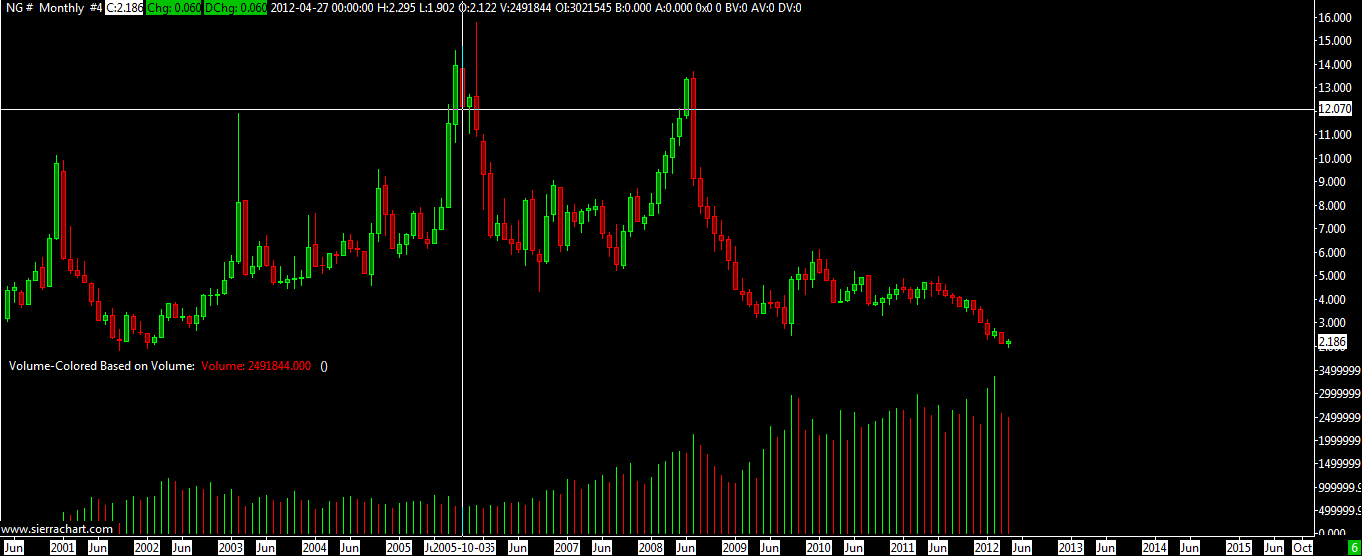
Also I am wondering if you could comment on this Natural Gas monthly continuous futures chart please?