Welcome to NexusFi: the best trading community on the planet, with over 150,000 members Sign Up Now for Free
Genuine reviews from real traders, not fake reviews from stealth vendors
Quality education from leading professional traders
We are a friendly, helpful, and positive community
We do not tolerate rude behavior, trolling, or vendors advertising in posts
We are here to help, just let us know what you need
You'll need to register in order to view the content of the threads and start contributing to our community. It's free for basic access, or support us by becoming an Elite Member -- see if you qualify for a discount below.
-- Big Mike, Site Administrator
(If you already have an account, login at the top of the page)
Classic example of delta divergence. New high, but negative cumulative delta. 1179 was also the 500ma on the 15m.
�Delta Divergences� can take many forms, but ultimately they show only one thing: the convictions of traders� choices do NOT match price movement. There is behavioral incongruence. Essentially, for a given price movement, there is a lack of aggressiveness which is normally needed (and associated with) to support continued price movement in a particular direction. In addition to the bar-by-bar type divergence shown above, divergences can occur over a sequence of an arbitrary number of bars.
Also note that the 2 bars preceding the 10:05 bar are relatively short bars. Bottoms and tops will more often be composed of longer bars than mid-range pivot points. The engulfing candle at 10:05 is noticeably longer and represents extreme prices being rejected.
The bar before the engulfing bar shows a positive cumulative delta, yet the best the price can do is is move up 1 tick from the buying. Next thing you know, the buying turns into strong selling, representing a failed auction. In addition, this occurs at a price level of significance (500MA) which makes this a high probability short entry.
It's even more evident on a 30 min chart. Huge engulfing candle with a huge negative cumulative delta. The pink dotted line is the bottom of value,the black dotted line is the top of the opening range, and the orange ine is the VWAP. Notice the market pulls back to the VWAP twice and gives you a nice entry.
Market profile confirms and also gives you a sell signal @1179 which is bottom of yesterday's value area.
I am not that familiar with delta divergences. What I see is that after the high was made, the bar closed down, hitting support at 1175.75. The down bar was also a bearish engulfing pattern. In my opinion this is not a divergence, as the same information can be obtained from the bar. But I am not sure, as I do not use market delta.
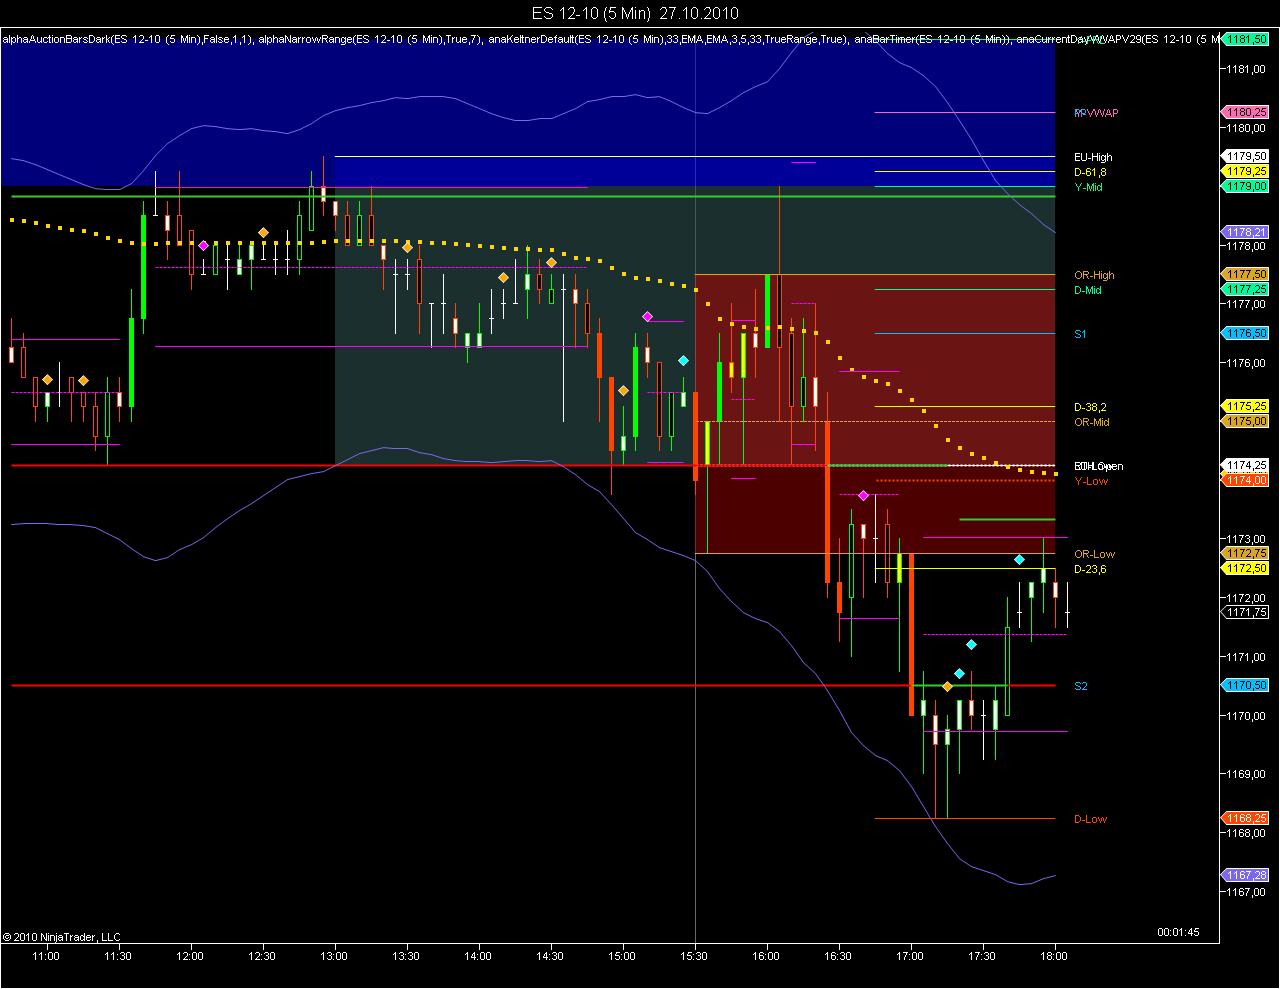
The high of the day was made when ES hit overhead resistance: The pivot range (yesterday's midline) and a major fibonacci line contained the bulls which quickly became the prey of the bears. You could have traded the massive resistance as well.
How do I know that you refer to a 15 min chart? Your chart attached was 5 min. As the 500 days SMA lingers somewhere in the distance further south, I did not want to check all the various timeframes available.