Welcome to NexusFi: the best trading community on the planet, with over 150,000 members Sign Up Now for Free
Genuine reviews from real traders, not fake reviews from stealth vendors
Quality education from leading professional traders
We are a friendly, helpful, and positive community
We do not tolerate rude behavior, trolling, or vendors advertising in posts
We are here to help, just let us know what you need
You'll need to register in order to view the content of the threads and start contributing to our community. It's free for basic access, or support us by becoming an Elite Member -- see if you qualify for a discount below.
-- Big Mike, Site Administrator
(If you already have an account, login at the top of the page)
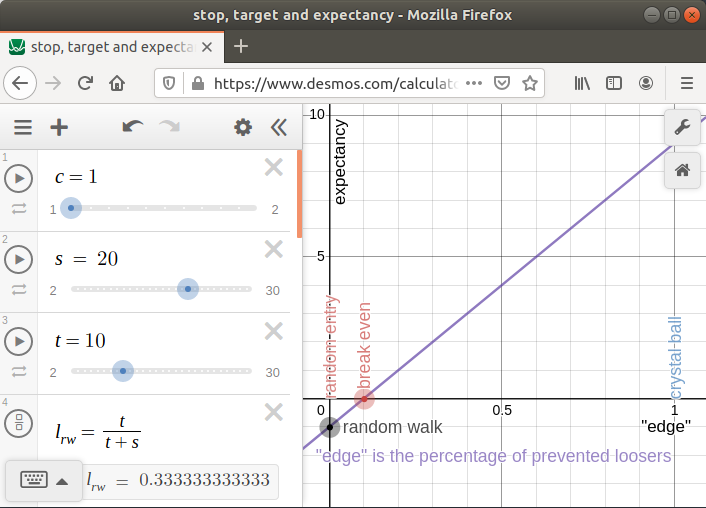
visualizing trade-offs between tight and wide stop and target
How would you incorporate those formulas into a linear regression of time and price to make it useful in a real world scenario?
Here is a daily chart of Nasdaq with a regression trend applied showing 2 deviations. You would need to take the coin toss scenario which you presented and somehow factor that into a joint or conditional probability calculation. The visual representation makes it easy to see where your odds lie but I'm interested to see how you would mathematically join stop/target odds with time/price probabilities.
This is still an active research area : )
Those calculations of mine were triggered by Timothy LuCarelli (ISBN: 9781626756335), with his pre-set wide stops and pre-set targets of sometimes 3pip. I wanted to quantify the downside of this method.
Cool, good work. Post when you figure it out, I think you have to use log scales to reduce it to a binary result but I haven't managed to work it out yet.