Welcome to NexusFi: the best trading community on the planet, with over 150,000 members Sign Up Now for Free
Genuine reviews from real traders, not fake reviews from stealth vendors
Quality education from leading professional traders
We are a friendly, helpful, and positive community
We do not tolerate rude behavior, trolling, or vendors advertising in posts
We are here to help, just let us know what you need
You'll need to register in order to view the content of the threads and start contributing to our community. It's free for basic access, or support us by becoming an Elite Member -- see if you qualify for a discount below.
-- Big Mike, Site Administrator
(If you already have an account, login at the top of the page)
To answer OP's thread: other traders. It really is subjective based on skill level, ability to read market, etc.
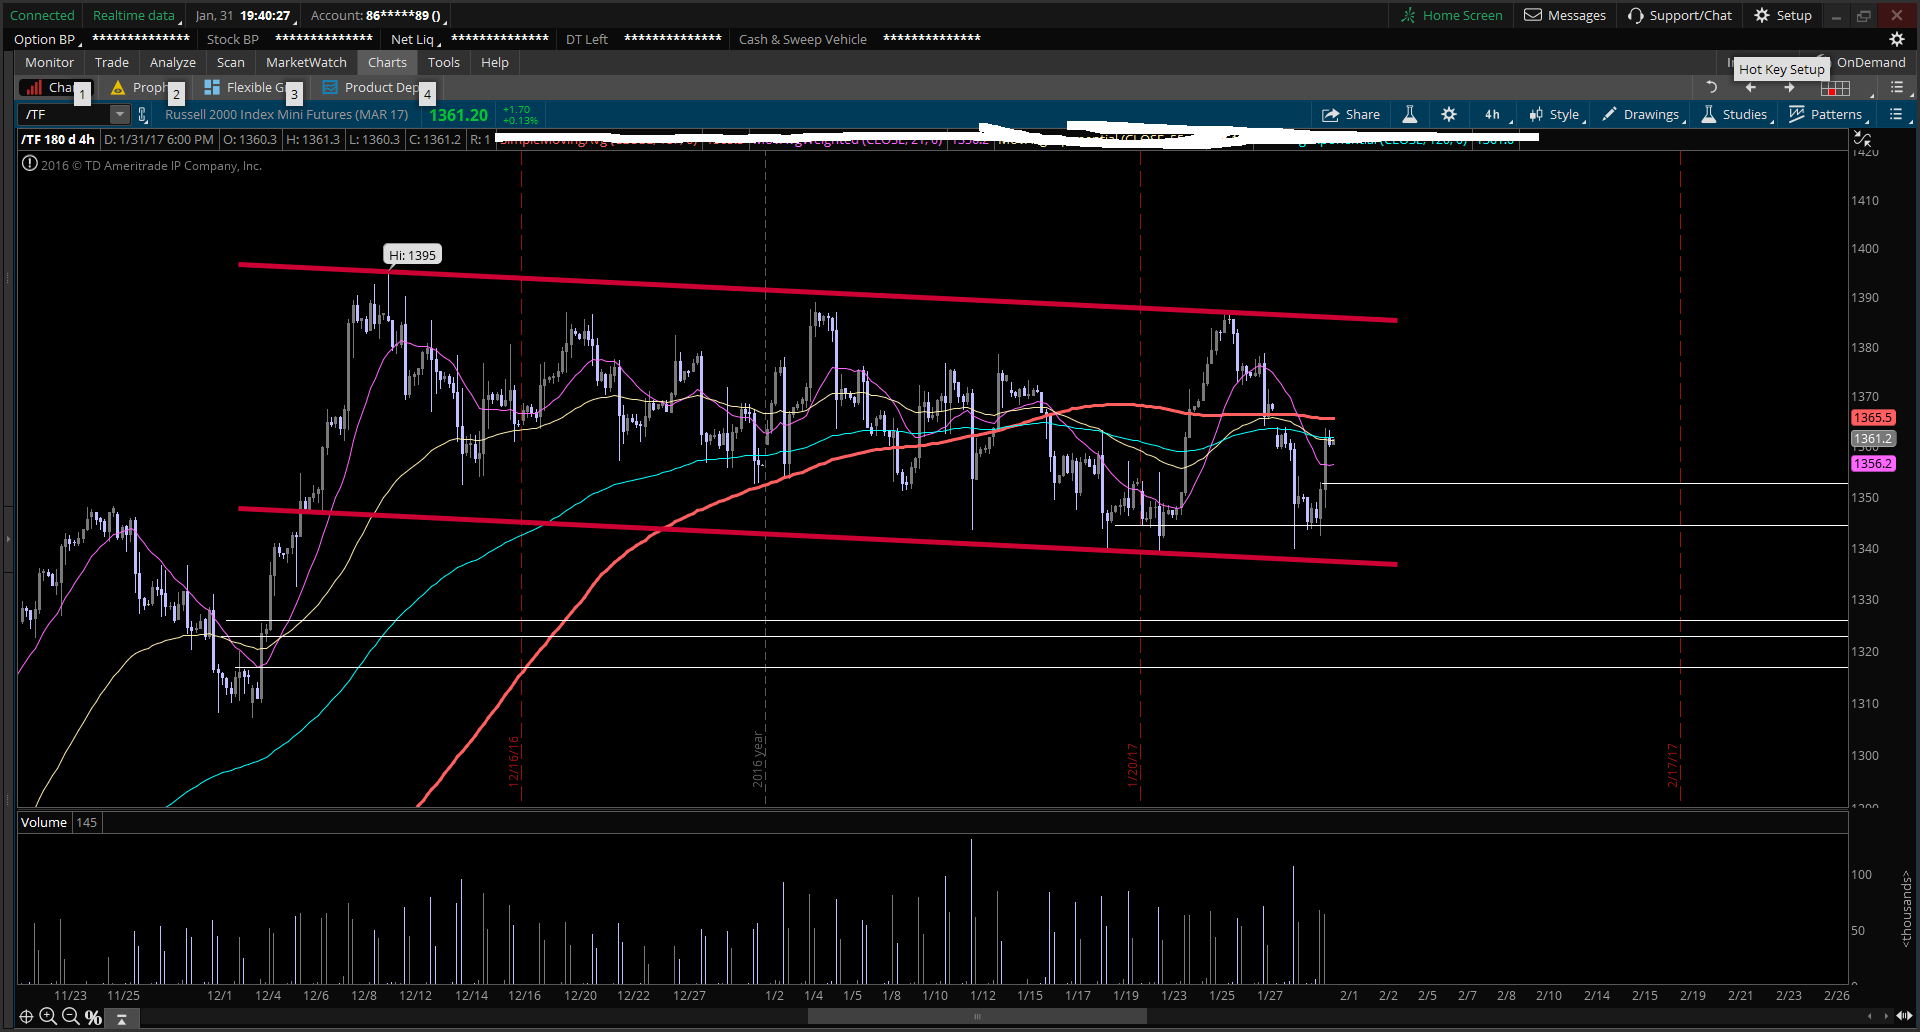
Take a look at this chart: I had white line marked as a support area..when TF was coming down.
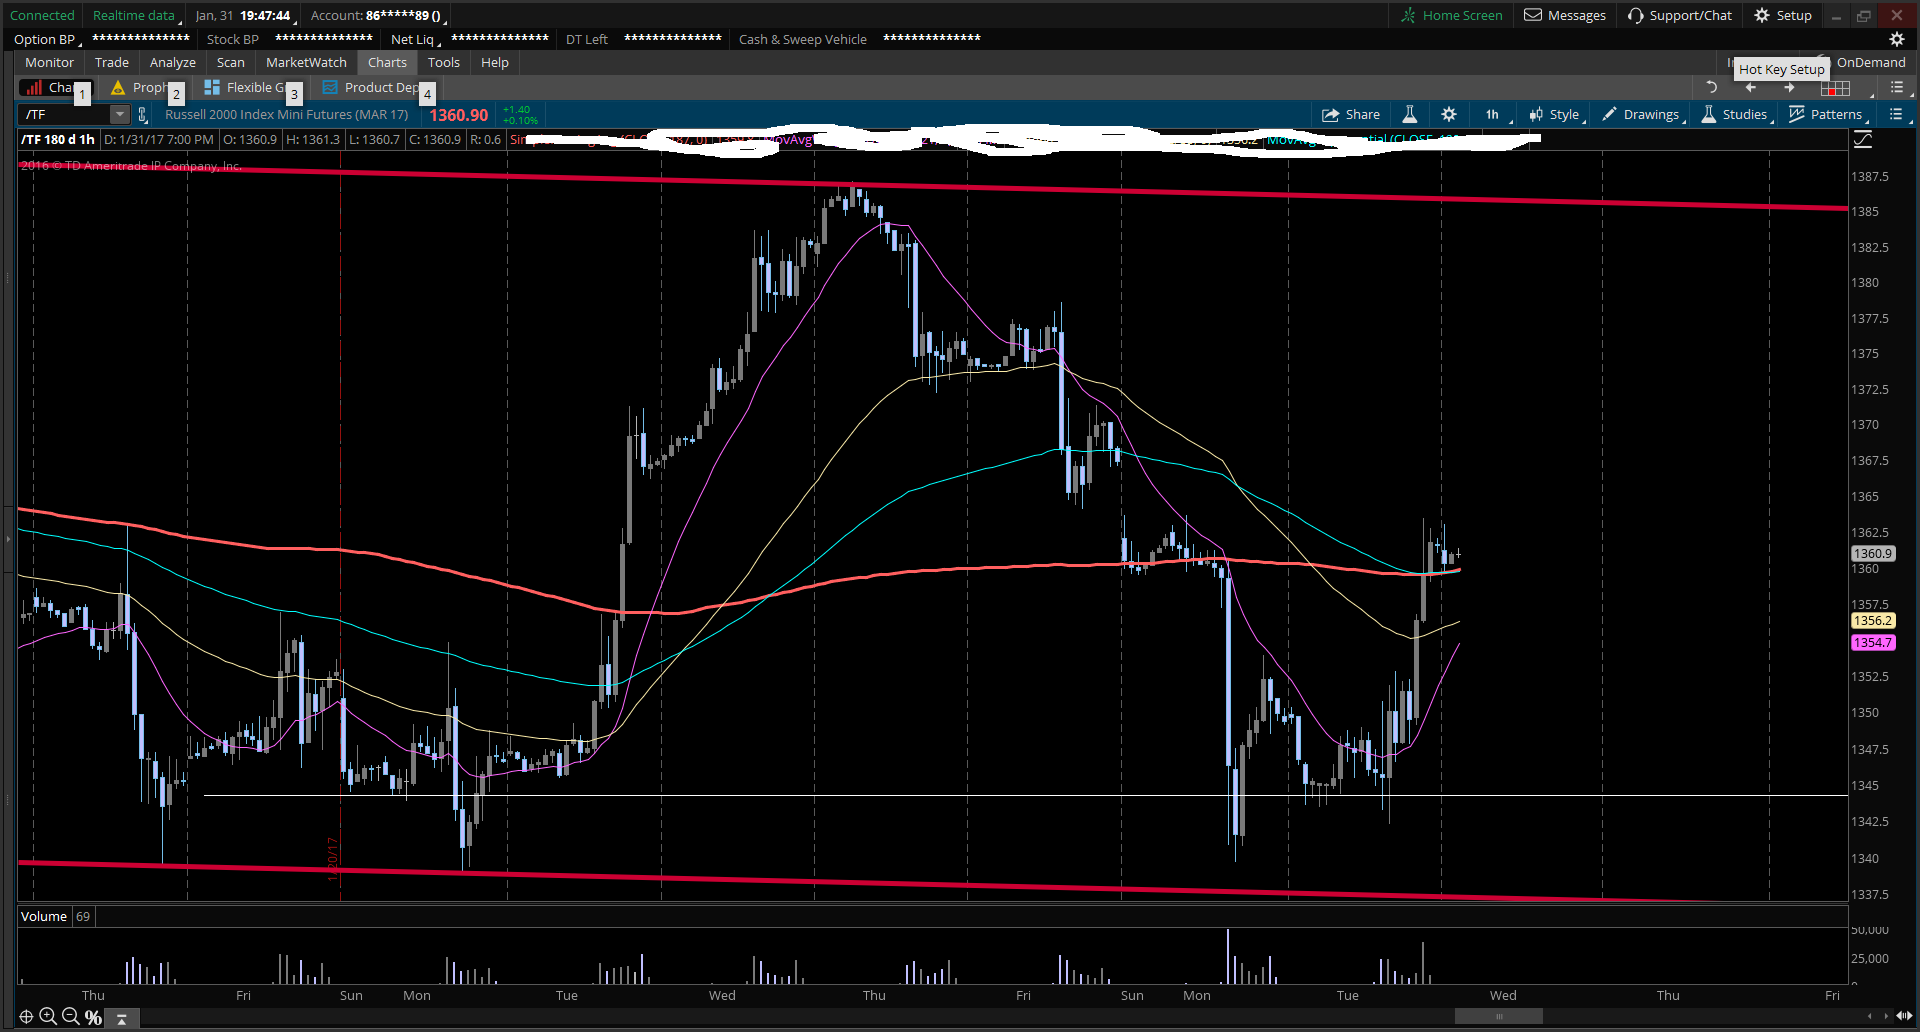
Zoomed in:
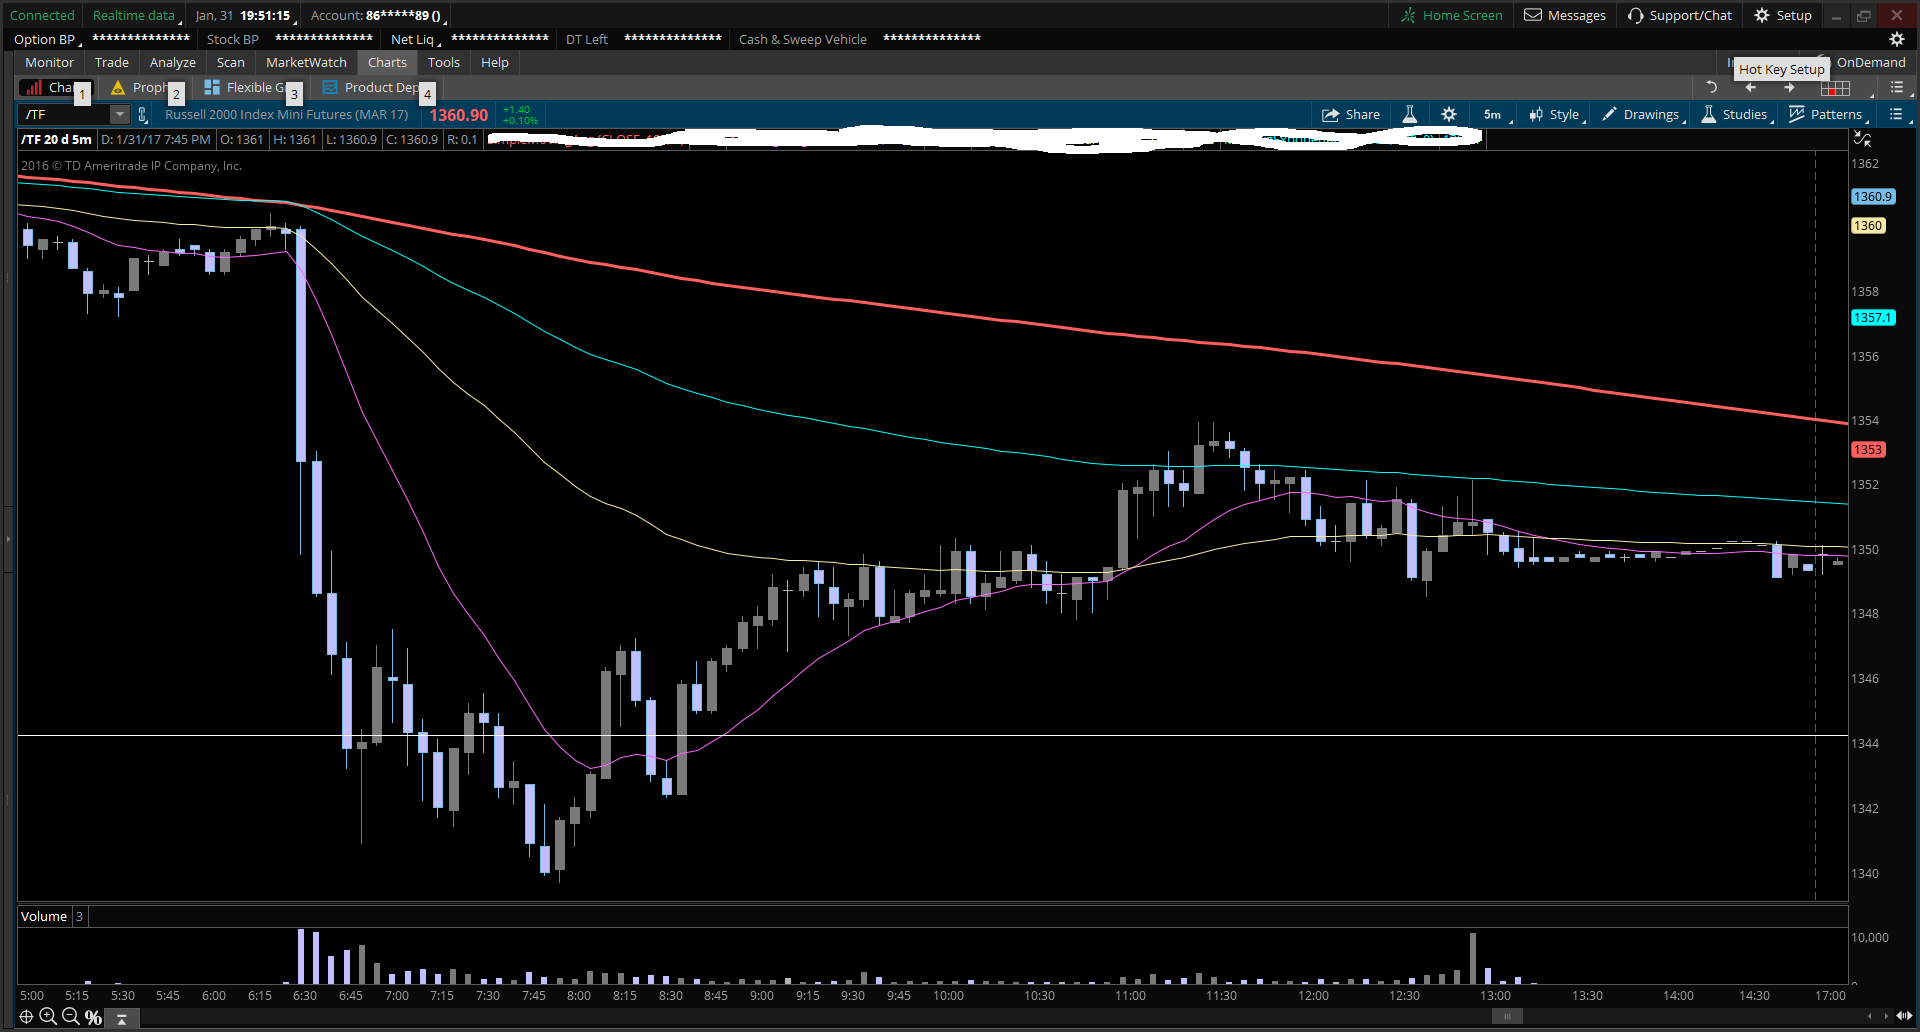
5min zoom. Initially pierced level by a few ticks....but then I saw a reversal candle formation there, so I thought other traders agreed with my level and I went long....but then it chopped up and down like a maniac around that level.....I started to question the long validity.
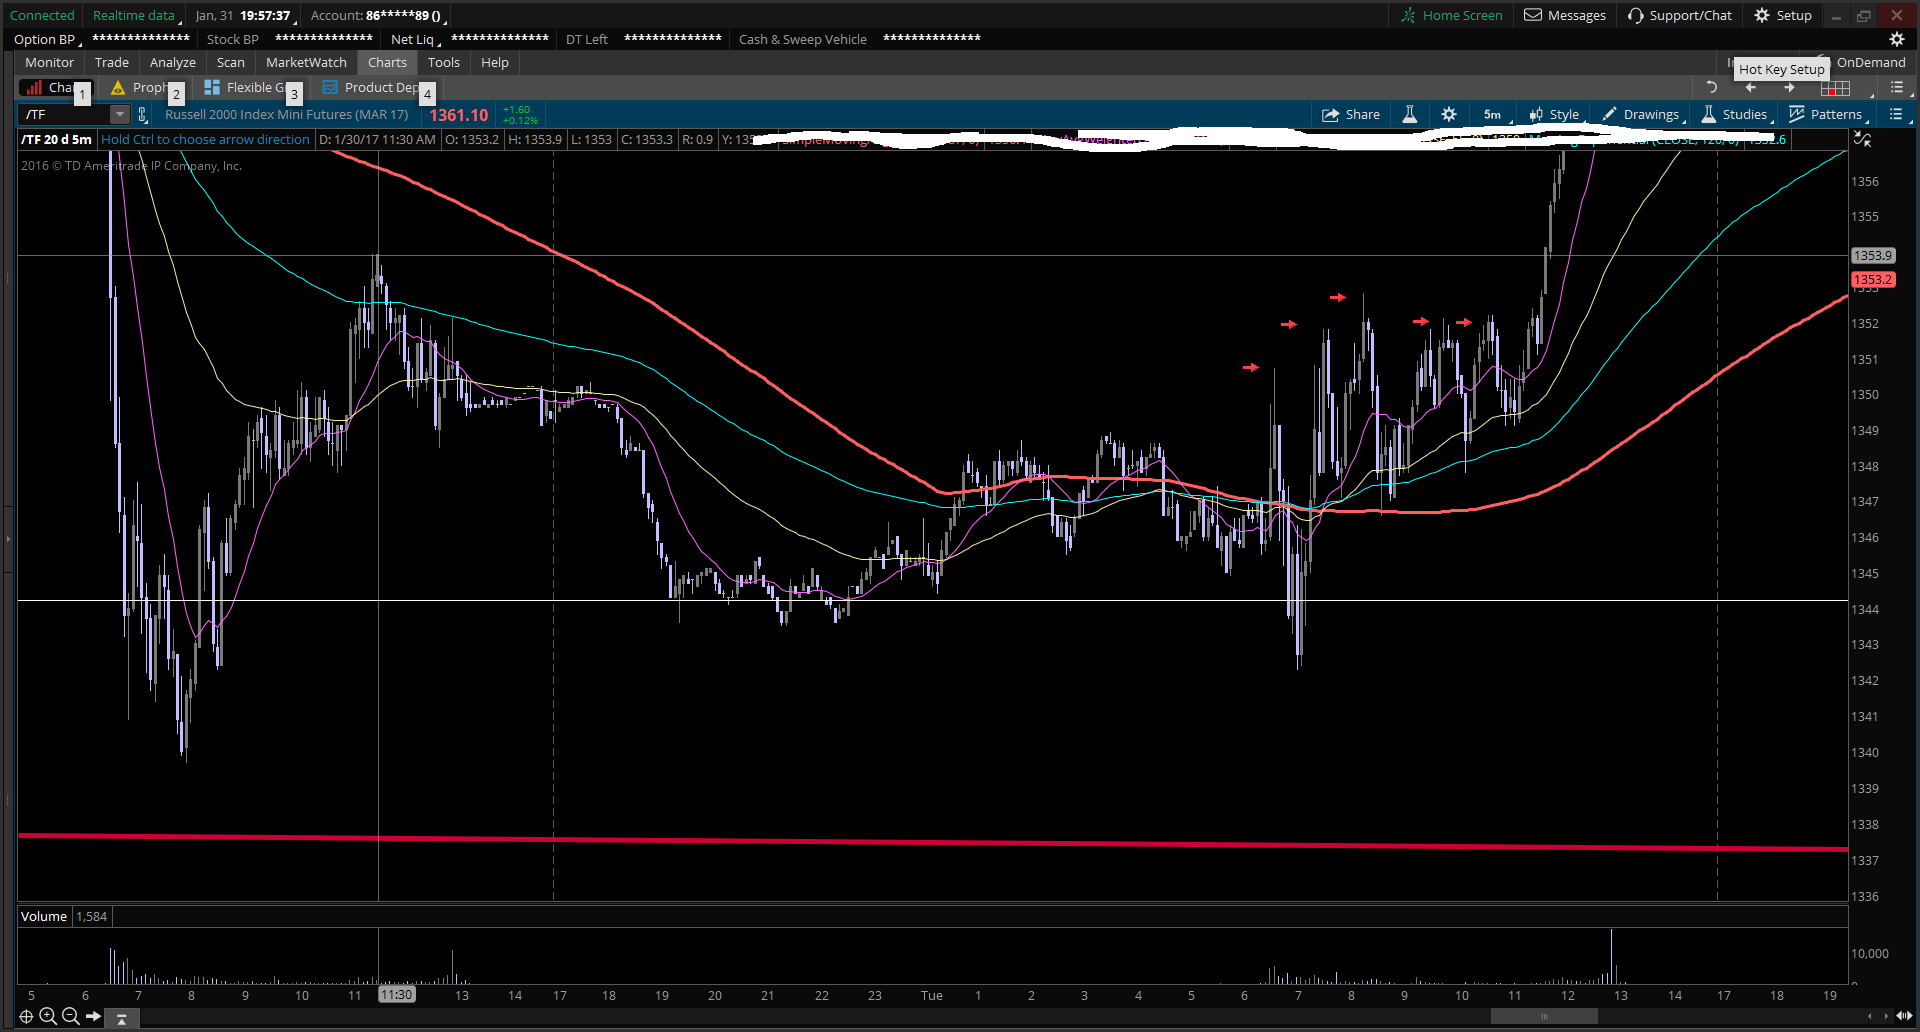
The next day: It chopped exactly at white line area overnight and on morning open......then took off
So with the examples, I guess you can say....when the democracy as a market agree as well as other traders to supply or support a certain level, it becomes a key level. It really is in eye of the beholder....That being said....I should stop fading alone after your question. My resistance level to sell into, isn't exactly where the market as a whole agree to be a supply area....
I'm also very interested in support and resistance trading. It seems to be one of the best methods, if it can be applied correctly. You need to determine whether the price is likely to rebound off the support or resistance or make a breakout.
I'm curious how you choose a timeframe for support and resistance trading? Do you look at only one timeframe or more than one?
Thanks.
I trade currencies using solely S&R. Used in the correct way , in my opinion, you will not find a more powerful consistent tool to implement into your trading. S&R on every time frame will get hit or broken all day everyday. They are much more consistent than moving averages. I find it most useful on the higher time frames (daily,4 hour). When you find a solid resistance level, it will either bounce or break, then that level becomes support. anyone who says they do not work is not using them correctly. I will post a picture of some price action on
I trade currency's as well with just support and resistance levels. I take yearly pivots on the spot market and transfer those levels to futures.
I think many get S and R a bad name as most day trade the levels. The levels get stronger the higher time frame. Here's a old usdcad chart I had for my journal. How many trading opportunitys do you see off support and resistance? You may also find the current level on this chart triggered an amazing trade on the cad breakout.
I use three time levels. A larger one to determine market bias and establish the dominant S/R levels. An intermediate level for entries and a smaller timeframe for exits. In my opinion the exit is the most important part.
Here is my two cents and opinion on why support and resistance levels do not always work. Price trades higher until it finally finds enough sellers in the auction to stabilize the uptrend. Price trades lower until it finally finds enough buyers in the auction to stabilize the downtrend. These buyers and sellers are constantly exchanging ownership of contracts at specified prices. As more motivated buyers step up and lift offers, price ticks higher. As more motivated sellers step down and hit bids, price ticks lower. The downside to using support and resistance levels comes from the fact that this is all they essentially are. A price level. Not something that has any effect on the motivation of a buyer or seller to continue to lift offers or hit bids. Let's say corn is approaching a key resistance level on a weekly chart. Well you think it just has to stop and rotate down from there, right? But let's say Joe the farmer from Iowa is in the market today, and he knows that crops have been looking like the harvest is going to fall short of expectations. So he puts his orders in with broker, along with most of the other farmers looking to hedge off their risk of a lower yielding harvest. And all of a sudden the motivations of traders lifting offers causes corn to go straight through that weekly resistance level and never look back. The same scenario basically plays out in every other market when a key support or resistance level is broken. Be it a hedge fund that does extensive research on the business climate in the US continually lifting offers at the resistance level. Because their analysis shows revenues and EPS are continuing to rise. Or an energy trader who just got news from his analysts that crude inventories are likely to rise for the fifth straight week. Causing him to continually hit bids at a key support level.
That is one of the best descriptions of why price moves in a long time. As a S/R trader I would like to add this. If your decision trade is "price has hit resistance therefore it will reverse, so I will now go short" the trader is missing most of it. Price at a S/R level only attracts my interest. It does not indicate an entry.
Take corn at or near a larger time frame S/R level for instance. I am interested and I am now looking for price action to indicate an entry. For example, a double top indicating a shorting opportunity or a breakout with a retracement that does not penetrate the previous level for a long trade. Those would be entries that I would look for at a S/R level.
. No. I wouldn't think only that. Why would I? I find this logic to be the exact opposite of the truth.
I call S/R trading breakout and fakeout trading. I know some ppl will differ w me on semantics but the point is that you're trying to decide whether the SR level will be broken or not. But thaaaaats the whole game. That's the trick. To sit there and say that that price doesn't always respect SR levels in the same way is like saying price doesn't always go in the same direction.
I get what your saying, your trying to decide whether to fade the move up as it approaches resistance, or play it as a breakout when it ticks above resistance. I think what I was trying to say in my original post is that fundamentals of a market will always surpass technicals. And be the larger motivation for the masses to either lift offers or hit bids. Regardless of how important the price level is. If I was going to trade a market purely on technicals I would probably have a program do it for me. Seeing as programs are much better at calculating mathematics than I and show no emotions. It's when the fundamentals and technicals line up that a great trading opportunity presents itself. Like studying weather patterns in key corn production states, seeing a trend of higher winds and less rain than usual and seeing a consolidation breakout on the charts just before harvest. That's a situation where the fundamentals line up well with the technicals and have a high probability of a continuation higher. As compared to just simply seeing a consolidation breakout and putting on the trade because technically it looks good.
Abhhhh I see now. Well I can't disagree with you but I'm not sure I *fully* agree either. This is a very important philosophy/theory question..... a critical concept here.
Smaller timeframes are of course more technically driven and larger are more fundamentally driven...which you clearly already know. I keep my systems intraday because I like having a lot of trades to gauge performance....doesn't mean it's better, it just fits my personality.
But I hear what you're saying and this is something I've spent a lot of time w my feet on the desk thinking about. In fact, as soon as I read your post, I put my feet on the desk. Where, when, why, and to what extent do technical vs fundamental forces each drive price. And to what extent do the two sides work in concert or directly opposed...or when do technicals inform fundamentals (or vice versa). I'm babbling in my typing bc I have to go. But yes, thanks for clarifying.