Welcome to NexusFi: the best trading community on the planet, with over 150,000 members Sign Up Now for Free
Genuine reviews from real traders, not fake reviews from stealth vendors
Quality education from leading professional traders
We are a friendly, helpful, and positive community
We do not tolerate rude behavior, trolling, or vendors advertising in posts
We are here to help, just let us know what you need
You'll need to register in order to view the content of the threads and start contributing to our community. It's free for basic access, or support us by becoming an Elite Member -- see if you qualify for a discount below.
-- Big Mike, Site Administrator
(If you already have an account, login at the top of the page)
Are Fibonacci retracements and projections useful?
I don't know, I can only go by what is shown in the video and that is you drawing the lines after the fact.
The biggest issue with Fibs is they don't tell you what to do. At least with a VWAP or MA you have some idea of what to do with it. In a bull trend if price pulls back to the VWAP you look to buy. Opposite in a bear trend. Heck even with an RSI it gives you an idea of what to do.
I have never seen anyone plot Fibs and the say when price gets to this Fib you should do x, y, or z. To me they are not actionable like other 'lines'.
In my opinion, that is because someone that is having success with fibs is not using them alone. They are considering context, multiple timeframes, solid "random" line work, price action and using entry triggers that make sense. There are certainly potential areas the trader is targeting for the move.
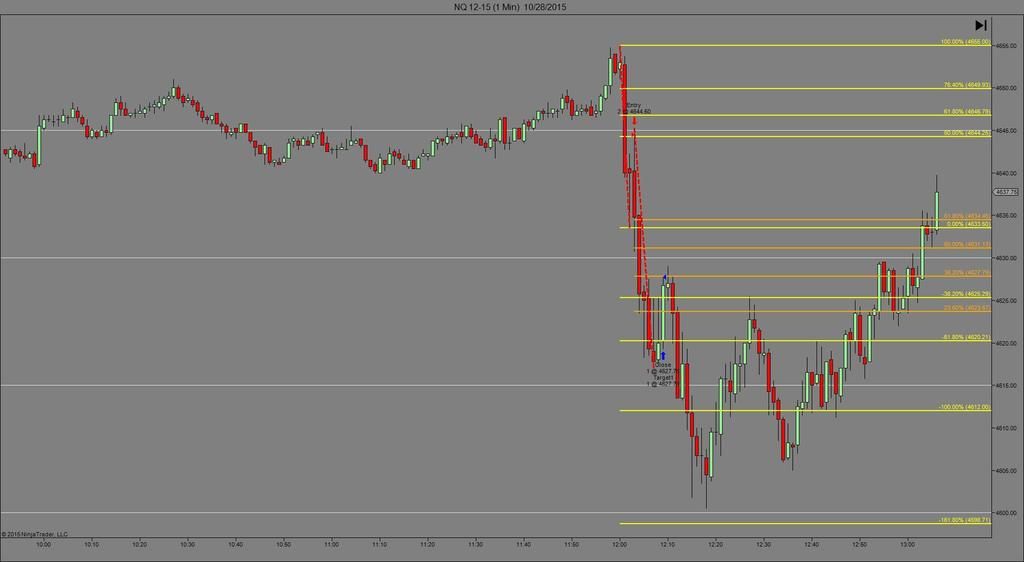
But look at these trades on these charts. There were definitely other factors involved in making my trading decision, but the fib lines helped to make the decisions. That is quantifiable and results oriented.
Actually closed position too quickly on this one, but look at the entry:
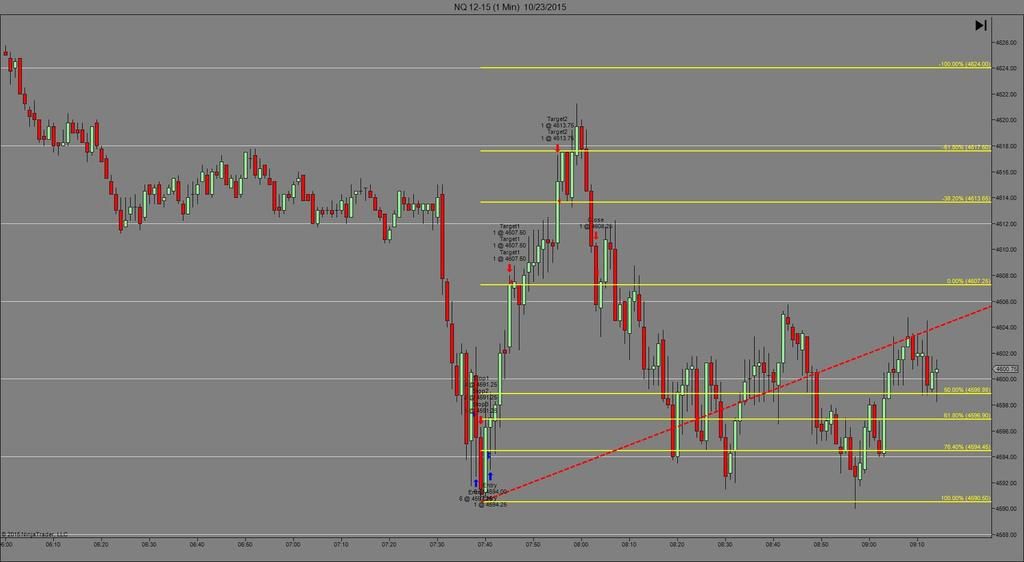
The entry and targets were for a reason:
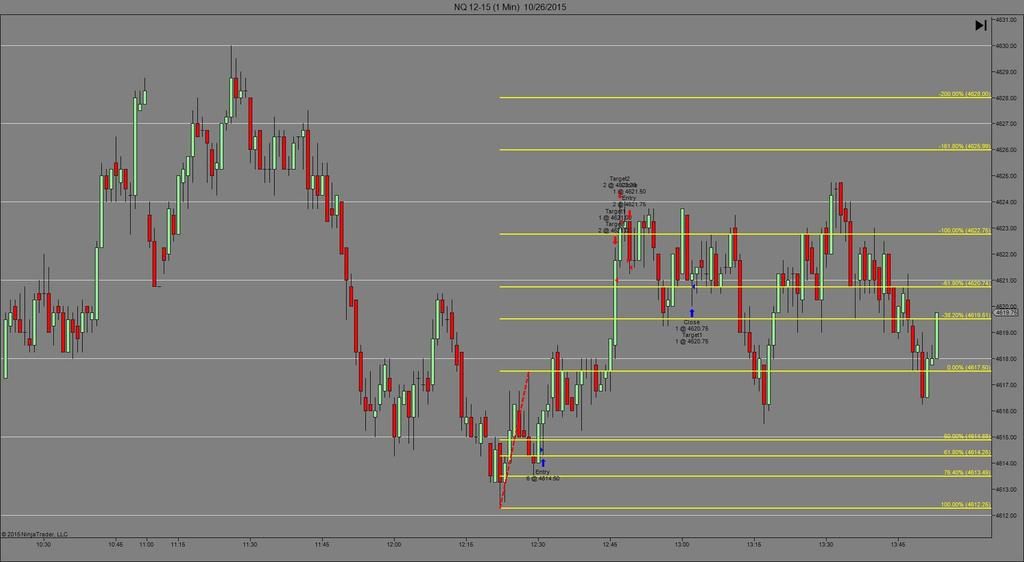
And here also:
Am I right all the time? Nope. Actually if you look close enough you will see a loss there on the 2nd chart .. which was my fault of course and misreading what I saw.
I appreciate the fact that you put this video together and posted it and the fact that the Futures.io community is BOSS enough to take their time to make screenshots and videos to backup an argument.
Thank you @spideysteve.
__________________________________________________________________________________
Ok here's the deal, the question is:
Are Fibonacci retracements and projections useful in a quantifiable way?
In your video you used a local "high" and a "mid morning low."
Why the mid morning low? Why "mid morning"? What constitutes "mid morning"? What if tomorrow there is no mid morning low?
Objectively, where do you start and end your fibs? What objective process do you use to put the fibs on your chart, and further, how, objectively, do you put on trades using fibs?
Everyone answering yes, and not a single shred of objectiveness related to fibs... Which was the question!
@spideysteve, If you are making money using everything you have on your chart, keep at it. No one can tell you are wrong if you are making money with your process.
My whole thing is:
Are Fibonacci retracements and projections useful in a quantifiable way?
If i would use Fibonacci in my day to day trading i would probably use something simple. Along these lines...
On the LHS, a 30 min chart with Fib lines plotted and recorded on disk automatically using certain swing pivots.
On the RHS, a 30sec. chart with the TriggerLines to gauge momentum. This is an application that could have been executed today without too much thinking.
Your charts are very difficult to see (very small) but I think over a 1-hour period you have 15 lines on the chart. Is that right?
You say there are other factors involved in making the decision, but that fibs help. My question to you is -- why is 68.1 more important than 65 or 71? Why is 38.2 more important than 35 or 45? If you drew 15 lines on a chart that were spaced every 5 ticks instead of by fibonnaci spacing, do you really think it would make any difference?
I think people are getting hung up here in what is "useful" and "why". It is useful to frame price by using some lines. By that doesn't mean that line is important, it is simply a frame of reference. Therefore, a line that is 68.1 is no more important than a line that is 65 or 75.
That's my opinion, and it has been well documented in the Random Line thread.
I'm also the only one on the site that I know of that has posted 6-months of real-time trades and multiple sources of proof to backup their accuracy. I posted 100k months along with 50k losing days, it's all there. The good performing days and bad performing days had absolutely nothing to do with any line on a chart.
It would be useful if someone trading fibonacci could do the same thing, and show why fibonacci is more important than just a random line. In real-time, consistently, every trade, every day, every week, for months. I am sure it would be very enlightening to everyone.
Fibs never worked for you because you "dyslexia'd" the the most critical one (61.8 ~ 68.1) I'm sure if you got it right you would have found the holy grail and be done trading forever by now
Depending upon the context, I would say 65 or 71 is close enough to validate 68.1. The S/R levels are not hard 1 tick lines are represented on most charts, they are zones of few ticks wide, usually 4-6 ticks for ES, sometimes more. The width of the support/resistance zones depend upon where the stops are placed. Not everyone places their stops at exactly the same tick.
For example, the price moved from $30 to $20 (40 ticks) and we are looking at fibs getting an idea of possible retracement. 61.8% retracement would be 40 * .681 = 27 ticks or $26.25 Stops 2 ticks higher comes to .725 and stops 2 ticks lower comes to .625.
If the move was 100 ticks, that 2 tick variances amount to .7 and .66.
If we accept 2-3 tick (sometimes more) difference between the line-in-the-sand support/resistance levels and the actual reversal price points as valid, how can we not accept the save variance in fibs represented as percentage?