Welcome to NexusFi: the best trading community on the planet, with over 150,000 members Sign Up Now for Free
Genuine reviews from real traders, not fake reviews from stealth vendors
Quality education from leading professional traders
We are a friendly, helpful, and positive community
We do not tolerate rude behavior, trolling, or vendors advertising in posts
We are here to help, just let us know what you need
You'll need to register in order to view the content of the threads and start contributing to our community. It's free for basic access, or support us by becoming an Elite Member -- see if you qualify for a discount below.
-- Big Mike, Site Administrator
(If you already have an account, login at the top of the page)
Help me learn to pick my targets for more than 10 tics
I have not defined my targets. Thats my problem. I am too scared of a loss to hold on for more.
The reason I take 10 tics is an old habit. @aligator hit the nail on the head. His reasoning has always been mine. I agree but disagree.
Like he says.... learn to take 10 consistantly and then increase contract size.
I disagree with him in the sense that I leave alot on the table in some of my trades.
Learning to let go of that fear is at that heart of my issue.
you are right when you say I do not need another indicator.
I need to do a better job at identifying the market structure I am in at the time I take a trade.
1. Channeling
2. trending
3. consolodation
4.
If you always do what you have always done you will always get what you have always gotten.
Celebrate because you executed your edge. Not because you won.
Can you help answer these questions from other members on NexusFi?
Hey Patrick. I'm pretty new to trading futures and also in the process of creating a strategy to trade for me. I'm pretty good at picking entry points within a few ticks, but blew up my account 1 time in a matter of minutes. For a long time, I was very nervous about getting into a position and would close out my position for 5 ticks or less because I was nervous about blowing up my account again. A few things I've learned from being on this site as well as from some trader buddies of mine I'd like to pass along to you to help you get over the hump of having a losing trade:
1) Never trade more than 1-2% of your account size in one position
2) To help get your confidence back in reading charts, scale out of your positions to lock in some profit.
3) Don't force a trade, let the trade come to you.
4) And lastly, but very important, plan your trade and trade your plan.
Hopefully this advice will help you as it has helped me. I actually still scale out of my positions, not because I'm worried about having a bad trade, but the first time I blew up my account, I always wanted that home run trade every time I got into a trade.
Now I take some money off the table and leave a few positions open to get the big trade. I have included an indicator that might help you with picking exit points. It only works on the current day, but very good indicator and I'm actually using in the auto-strategy I'm putting together. The indicator does a good job of plotting support and resistance and is very helpful when trying to determine your targets. Of course, using a few other indicators would definitely help in seeing where you should place your exits.
Sorry Mike if my response isn't appropriate for the section, but I went through how Patrick is feeling and just thought I might pass on some knowledge that was passed to me.
I performed a search under the quiery of targets and found an audio @Big Mike did about 4 years ago.
In it he told me that I do not need another indicator. Mike basically said I need more screen time.
I need to Journal
I need to accept that I am going to have OFF days and lose money.
I need decipher market structure and plan accordingly.
@aligator is corrrect also when he mentioned CONSISTANCY.
Looking back on my Journal I realize that I only have about 45 days journaling the CL 5min 6 range chart set up.
Not enough time to realize consistancy.
As usual my lack of patience is screwing with me.
I was getting frustrated to see others pull in 20-30 tics and thought I was doing somthing wrong.
I will relax and continue to work on my consistancy of discipline
My qustioned is anwered.
If you always do what you have always done you will always get what you have always gotten.
Celebrate because you executed your edge. Not because you won.
Having read pretty much all of your journal, I'd say that the final item you listed here should be given #1 priority.
Citing lack of patience and discipline is a very common thing to do. I think this is because it sounds good, and it gives us a quick "out" -- after all, who doesn't need to work on patience and discipline? However, it is not actionable, and not specific, and thus you have set a goal that is not measurable (and thus not attainable).
Patrick, as I have said before, I think you tend to buy too high, too late, and sell too low, too late, based on looking at your journal. I'd like to use an example of your trading from this past week that you posted, on Tuesday, 2/26. You took two winning trades (good job!). This is a structural analysis of the market on that day. The good news is that you were looking to buy, which is really a win in and of itself. I sometimes let a preconceived idea cause me to fight the market, and it's always a losing battle; in this case, you did not fight the market but you went with it, which is really great.
Here is a chart showing Monday and the first part of Tuesday. I have drawn a profile over Monday; I know you do not use this methodology but even if you don't, the principles found within can be quite valuable, and it goes straight to the heart of setting targets, which this thread is about. This is a 6 range, which is what you seem to be using.
As you can see from Monday's trade, there were two distinct distributions of trading activity: 93.85 to 93.38, and 93.38 to 92.68 (or so). If you look at premarket trade on Tuesday morning, you will notice that the market spends all of its time below Monday's low. Then, heading into the open we get a break north of all of that trade, and within the first minute we are back into Monday's range. What we are observing are buyers who are responding to lower prices. Off the open, this is strong, bullish behavior and we should be looking to join the buyers, which is what you were doing.
Now, what about targets? Well, when a market is trading below prior value (as it was at the open), often the most logical place for it to trade is the most fair price traded from before. This was about 93.17 as you can see, but could also include the whole cluster of prices there, so call it 93.07 to 93.17 or so. This is a logical first target for your long.
Now, after the market trades down from that level (the high at 9:20 was around 93.21), you have a decision to make. Is the market still a buy? Well, use whatever you like to determine that, but if you determine that it is (and you did, because you bought), then you need good enough trade location that you can have relatively low risk, given the potential reward. Consider this:
Hopefully the commentary is self-explanatory. Now consider this:
If you look back on the first chart, you will notice the resistance late Monday at 93.40, as the market failed to break back into the distribution formed early in the day. This distribution boundary which logically coincides with the resistance at 93.40 is a great next target for your long. So at this point, the market has traded above yesterday's fairest price. However, it soon trades back down to the fairest price of 92.95, which is probably a logical buy. Then, however, it begins to trade much lower and below prior support and the value area low of 92.94, and at this point with a possible loss after buying at or below value, it's time to re-evaluate things and recognize that the market is not even buying below value, so perhaps a short trade is warranted, or simply observe. Not coincidentally, look what happens next:
First notice how the perception of value has changed. Look how thin the trade is above 93, and how new value has been established centered around 92.70. Yes, the same fairest price of 92.95 now is tested, and sellers demonstrate their willingness to sell at this price. Trade below is now considered more fair, so anything higher, namely in this case, the fairest price, is good enough. Afterward we go on to make new lows.
To sum it up: there is rarely a reason except in the strongest and weakest markets to pay higher than fair value. If you are, it means you have probably waited too long to buy or sell. Buying high and selling low is what suckers do; so instead of being a sucker, take the other side of the sucker's trade, and buy when the market is cheap relative to current value, and sell when the market is expensive relative to current value (always keeping in mind the context of the day--for example, selling above value is foolish on a day which is trading and building value higher, as Tuesday was early). Ask yourself--what is currently fair? What was fair yesterday? What was unfair yesterday, and what is unfair today?
What I have tried to do here Patrick, is to show a structural analysis of the market you traded that day, taking into account the prior day's trade, and today's trade in relation to that. Further, I showed how you can arrive at logical targets. Finally, I hopefully made the point that good entry location reduces your risk exposure, and puts you into a trade at a price further away from your target, so that you have a smaller risk, and larger potential reward.
Thank You for that detailed reply. I know it took you some time to put that together and I appreciate your thoughtful and well worded reply.
I think I can finally see what you have been trying to teach me.
I can definitely see the value in using market profile and I need to study it and apply it to my current methodology.
Deciphering market structure will become my #1 priority.
If you always do what you have always done you will always get what you have always gotten.
Celebrate because you executed your edge. Not because you won.
It did take some time Patrick, but it was actually helpful to me too because I got to see principles at work in a market I do not normally follow. I am glad you found it helpful. Please note that I am not suggesting you even consider market profile; simply consider value, which you can often see on a plain candle/bar chart. No one needs market profile to be successful; we simply need to understand what is fair, and what is low and high in relation to that.
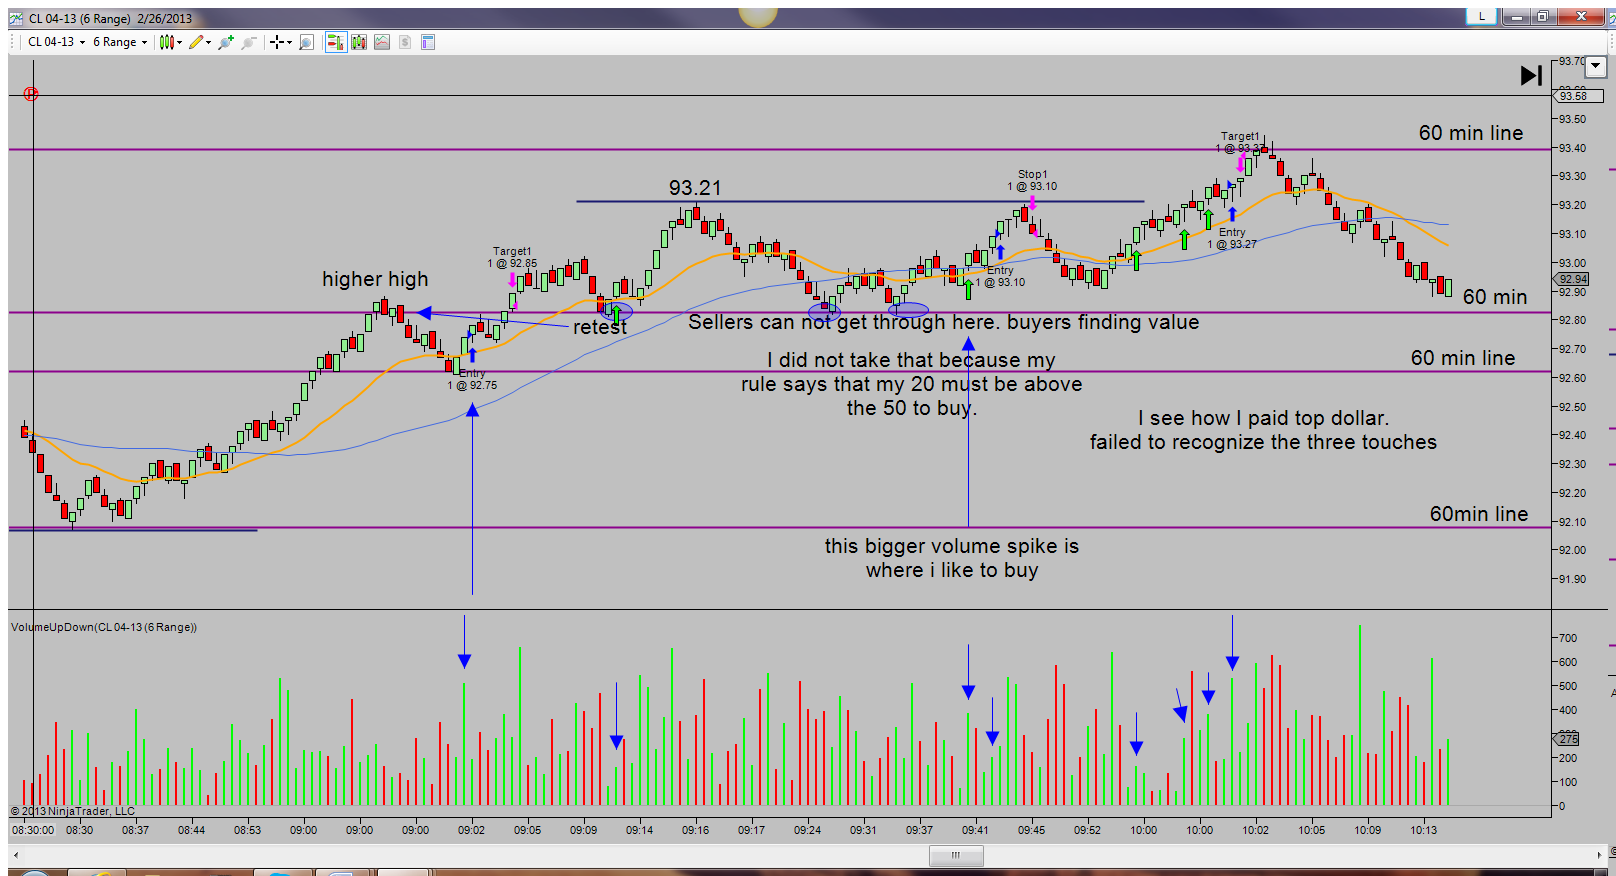
I see how I paid top dollar and failed to recognize the bears could not get it below that 83 area.
I failed to recognize it punch through 92.86 and then retest it 3 times.
If I could learn to spot this action a little better I would not need market profile.
I wanted to share why I took those trades.
After I draw my 60 min S/R lines based off of the past 6-8 days I will draw in some 5 min lines based on 2 days.
The primary chart I watch is the 5 min.
If I see value areas setting up I must wait for the range chart to give me permission to get in.
my range chart entry rule is the 20 EMA must be above the 50 SMA
The second volume bar must be of greater value.
I like the increasing volume factor. It shows me more buyers piling in.
the buy I took at 93.10 would have tested that 93.21 and paid me my 10 tics but the 5 min bar closed and had no interest in testing the 93.21. I moved the stop to BE and got lucky.
@josh is right. I paid full retail.
I hope you understand the method to my madness a little better.
The first and second retest gave me a higher volume spike.
Not sure why I skipped the first one. must have had somthing to do with the 5 min or I just plain missed it.
I have had a few beers. I am starting to ramble.
Good night
If you always do what you have always done you will always get what you have always gotten.
Celebrate because you executed your edge. Not because you won.
I can see how this might be a helpful guideline, but in a market that is not strongly trending, you will get plenty of intertwining MAs, and your 20 will be above your 50 at just the time you should be selling, and the 20 will be below the 50 just when you should be buying. And this goes to the heart of what it means to buy at or below value. A 20MA that is on top of a 50MA simply means that prices are more expensive on average in the last 20 bars than the last 50 bars. That doesn't mean you shouldn't buy of course, but having this rule will prohibit you from buying at a discount on many occasions. Consider whether it really helps you, or whether it simply gives you the comfort of thinking you have more confirmation and more information. This gives you the illusion of more certainty, which paradoxically makes the likelihood of the trade now working either no better, or even less likely to work.
The main idea is this: price does not equal value. When price stretches too far from value, except in the very strongest or weakest of markets, it will revert back closer to actual value, giving you an opportunity to buy or sell at a fair price or better than fair. Yet, at that time when price is stretching too far from value is the same time your moving average will be saying to do the opposite. For example, the market goes up strongly, and your 20 is over the 50. Yet, value cannot be established higher, so the market will revert or "pull back" closer to value. At about that time, the 50 will still be moving higher, but the 20 will have turned lower, and is now below the 50. Yet, this might be a very legitimate buying opportunity. Of course, sometimes it will seem like magic that the 20 is below the 50, and the sells keep on working. So, you really have to determine if this is a rule which is beneficial for you through some actual testing, even visual inspection, and maybe the answer is yes.
Sometimes this can be a very good indication -- volume increasing as the market moves to new highs. But there are two things to consider:
1) In all markets, but particularly in a thinner market like CL (thin compared to bonds, ES, euro for example, though very liquid among the commodities), you may get a very positive move higher on thin volume. Increasing volume on a move up means not only that buyers are aggressive, but it means that sellers are stepping in to slow the market down. Increased volume means increased participation, on both sides. Volume does not speed up a market, it slows it down. Sometimes heavy volume will mean continuation is imminent, sometimes it means exhaustion and a short or long-term reversal.
2) The real consideration is the value of examining volume on a 6 range bar-by-bar basis. As mentioned earlier, if volume is less on the second bar you are looking to enter on, it could simply mean that many offers are pulled--this would not necessarily indicate lack of buying interest, it would indicate lack of selling interest as a short-term liquidity vacuum is created. Examining volume in waves, as a trend, can be far more valuable than looking at individual bars, though it may be helpful at an extreme like a retest of the high of the day. The market knows no such thing as a range bar, and you are assigning a lot of meaning to the volume on a very short term (6 ticks) bar. Again, consider the implications of this and whether your reasoning is sound in having such a rule that must be satisfied.
In short, volume can be a helpful tool, but unfortunately it does not obey rules such as "increasing equals continuation." It is good IMO to look at it on a case-by-case basis. Some of the best times to buy are when the market sells off and is held up by heavy volume. Just look at a CL 1 minute chart and just about every day you will see that many of the best buying opportunities are when the market has sold off, the volume is in the 1.5 to 2K range in that one minute bar, indicating buying interest as the weak holders and suckers sell (no coincidence, these are the traders who waited for "confirmation" and are selling too late). Other times, that heavy volume will simply pause the market, and it will then continue to plunge. On the other hand, sometimes volume will simply dry up, and a market reverses this way. In other words, there is no rule about what volume should do, so considering it on a contextual basis will give no guarantees, but will present you with the most opportunity to actually think about the situation and make your best guess.
Through all of this, I'm not suggesting you change your rules. I'm only suggesting that you consider the logic behind them, and consider through some objective measure whether they actually benefit you, or whether you have them because they add the perception of structure (having a rule for a rule's sake). Maybe the do benefit you, and if so, then it's good you have them.
Hey, I'm rambling and not even with the benefit of a beer! Enjoy your beer and have a good evening Patrick! (read this again when sober, it will make more sense )
Thanks for not giving up on me @josh
I grew.
I realized you are not the dick I thought you were.
You genuinely cared enough to write that detailed reply and I saw the light.
Maybe you grew a little too?
It really does not matter. I know I feel much better about learning to take more than 10 and I can thank you for that.
I am sure I will read this thread many many times and apply it.
I think I am going to get rid of the 50 off of my Range and throw out that rule.
Using the 20 as a visual to determine how far off of value I have gone.
I hope @Panda reads this thread.
If you always do what you have always done you will always get what you have always gotten.
Celebrate because you executed your edge. Not because you won.
1st thing:
Be careful when you just sling out the 20/50 rule and consider what you are losing.
Don't sling it until you replace it with something that does what it was doing ....but better.
For you the 20/50 was a sort of short term trend filter. So ... what will you replace it with ?
2nd thing:
Your issue is with target setting. @josh has a pretty extensive method of how he sets targets ...and does it in a way that is not a fixed distance from the entry point. You have a method for finding entries - but none for your exits. This means that you take on all the fury and risk of the CL but never benefit from the runaway movements.
I suggest to first look for the trades that you want to catch:
1. When you are journalling and searching use indicators like anaThrustBarsv2 to spot the interesting areas that you want to see
2. You might like to also look at the Momentum Bars and Reversal Bars and see what you can find
The purpose of your search should be to find the trades that you want to get, then to set targets look for what happens at the exits that you would like to take. Look for the exits in the same way that you have found a way to enter. Define them in terms of things other than price. Exit on market condition.


 Enjoy your beer and have a good evening Patrick! (read this again when sober, it will make more sense
  )
)