Welcome to NexusFi: the best trading community on the planet, with over 150,000 members Sign Up Now for Free
Genuine reviews from real traders, not fake reviews from stealth vendors
Quality education from leading professional traders
We are a friendly, helpful, and positive community
We do not tolerate rude behavior, trolling, or vendors advertising in posts
We are here to help, just let us know what you need
You'll need to register in order to view the content of the threads and start contributing to our community. It's free for basic access, or support us by becoming an Elite Member -- see if you qualify for a discount below.
-- Big Mike, Site Administrator
(If you already have an account, login at the top of the page)
Day Trading Support/Resistance Levels on the E-Mini S&P500 Futures
The thing about gaming and strategy in general is that we must know who we are playing against. Sometimes I "outsmart" myself by getting too deep into what-if scenarios. Sometimes the newbie strategy works like a charm. Other times the gaming is on and we have to play chess. The challenge is I think reading who we are playing and what they are doing. Earlier today I did this very thing and "outsmarted" myself ("outdumbed") a bit, and never got a chance to get back in because I was expecting a bit of chess, when the game was really just checkers at that point (or maybe I was in level 2 chess and they were in level 5 ).
I agree Josh. At the end of the day, every trade is both a buy and a sell. You can never know, you can only make an educated guess.
Playing these levels is like swimming where the sharks are. Some people will just jump in, not even knowing sharks exist. Other people will wait till the sharks have fed and are full and sleepy.
Overthinking things can be just as bad as not considering them at all. I can't tell you how many trades I closed early because I thought my way out of a trade once I'd got in.
The good thing about overanalyzing things, is you can ease off a bit. Ignorance to what is going on is not as easily fixed!
"Know Thy Market" is something I have advocated for quite some time but I like the way you put it, simple and effective. If you don't know your market, the odds of being successful at it are effectively zero. Yet, knowing one's market is, as you said, not an overnight or instant gratification type of approach (thus, few will take this path). I am going to hijack this and make it my custom user title.
How late would you consider too late? You're speaking of an 8 tick window to know whether or not you're in the clear, so I would think a max of 4 ticks late?
If you use a strategy that adds to your position when you're in the clear, I'd like to hear how you go about that (may be off topic for this thread, if so nevermind).
Do you play the 8 window tick at all? Perhaps scalping 4-6 ticks on a partial position, would you recommend this?
"In order to excel, you must be completely dedicated." -- Willie Mays
Thanks for the interesting thread. I've utilized support and resistance swing trading strategies on equities for 25 years and and believe them to be extremely rewarding setups provided you are patient and wait for the shenanigans to play themselves out.
I prefer to have fairly solid confirmation either the resistance line is rejected or the resistance line is breached and is quickly rejected. I'm not sure the footprint/ladder is useful for trades like this as it encourages fairly tight stops and scalping. Based on my experience tight stops don't work well for trades like this as the volatility will likely stop you out requiring 2 or 3 reloads before you get one to go in your favor. By then the opportunity is often gone. That has been my experience at least. The problem with this approach is it requires higher $ risk and a stomach for large losses when they occur. It also requires the trader to cover overnight initial and maintenance margins.
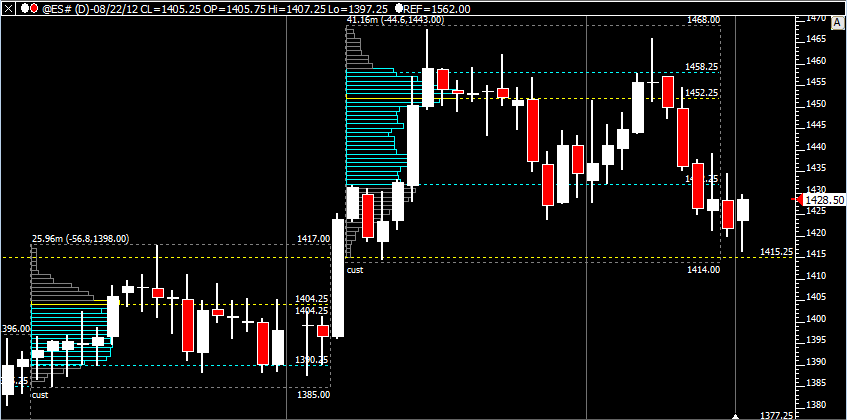
The new tools I've found on the forum, in particular the volume profile enables the trader to better assess the opportunity on a risk adjusted basis in my opinion and am employing these on a daily basis for futures trades. For example, if you look at the chart below you can see how gold set up beautifully recently.
We can see on the 1440 min chart on the top pane gold hit late February 2012 resistance at $1800 an ounce. We can see the topping tails on the highest two days. This was quickly rejected.
The lower chart shows the volume profile of gold from 14 September. It has been in fairly strong balance from this date. The thick light blue lines are the value area highs/lows. We can see a fairly symmetrical volume profile with valid ideas of targets. Entry is at the white line as falling value became apparent. First target is back into the heavy traffic POC area (lime line) and the second target (cyan line) near the value area low. This provides an adequate risk/reward ratio of 1.3/1 on either 2 or 4 contracts. Note how much confirmation was needed with a couple of valid entry points on the 10 Better Renko entry chart (not shown).
We now see gold is below value. I'm waiting it for a return to the value area, stabilize and move into short term balance. If this happens the trade can be replayed on the long side.
Before I answer this, let me show you where I was pre-market yesterday & then look at yesterdays action.
============================= October 15th, 2012
Europe Up, Asia Up
We have a line in the sand there @ 1414.50. If we break that then I think the downside looks good. We had a peek down to 1416.50 today and we are up 13 points from there, so we may well now be headed back to the top end of our range. I�m still long biased overall right now.
So - my overall bias was for an upward move & 1421.75 was one of my areas to go long.
So - first bit of nuance is that I have multiple levels to watch and I consider my long areas to be support. I do not need the price to be a prior swing low to call it support. I'll get into that more later but anyway - let's just understand that 1421.75, being yesterdays close, takes us back to unchanged (and fills the gap). As such it is support...
So - we moved down towards yesterdays close, I have a long bias. We failed to hit the level.
An early entry would have been 2-3 ticks above the low - presuming you got confirmation at that time. To me confirmation = a backstop. Something in the order flow that shows that people stood up here.
Ideally, this will come in the form of:
1 - A "Hold" - someone absorbing selling
2 - Buyers coming in, in force & in size
You can get in when you see the hold - that's your backstop after all. This is the more aggressive entry. You could wait for other buyers to jump in - BIG BUYERS - 300+ lot buyers. This is less aggressive but will cost you 2-4 ticks.
Now - let's say you don't take this trade at all. You miss the bottom. You see the market move up.
What you have now could be a pullback in a down move OR a new up move - there is no way to be 100% sure. Of course, we know with hindsight now.
The key IMO is that the market has put in a short term reversal at a very common support level. This means that the chances that this is indeed a reversal are higher.
By the time we get to the 3 areas marked "B", we have delta moving up, coming off a common support level and much higher volume/ticks moved on the upswings. The pullbacks are also getting into a rhythm size wise. You look for a backstop on one of these pullbacks. You should be able to nail that 2nd pullback (from the 3 marked "B") and could take a shot at the third but at that point you've moved 6 points so anything later would be risky considering the volatility on the ES (or lack of).
Everything is easy in hindsight of course. In this case "too late" is 5 points away from the reversal itself. I still think this is playing support though because if you miss the support level itself, it is support that allowed you to reset your bias.


 ).
).