|
Brooklyn, NY
Experience: Intermediate
Platform: Sierra
Trading: GC, CL, Indexes
Posts: 21 since Jun 2010
Thanks Given: 50
Thanks Received: 9
|
I started trying to post this at Sierra but after struggling for an hour to comply with their laborious chart posting requirements after I had screen-capped them already, I gave up.
Anyway, my query may also lead to a more general question, or answer, about how Sierra studies behave:
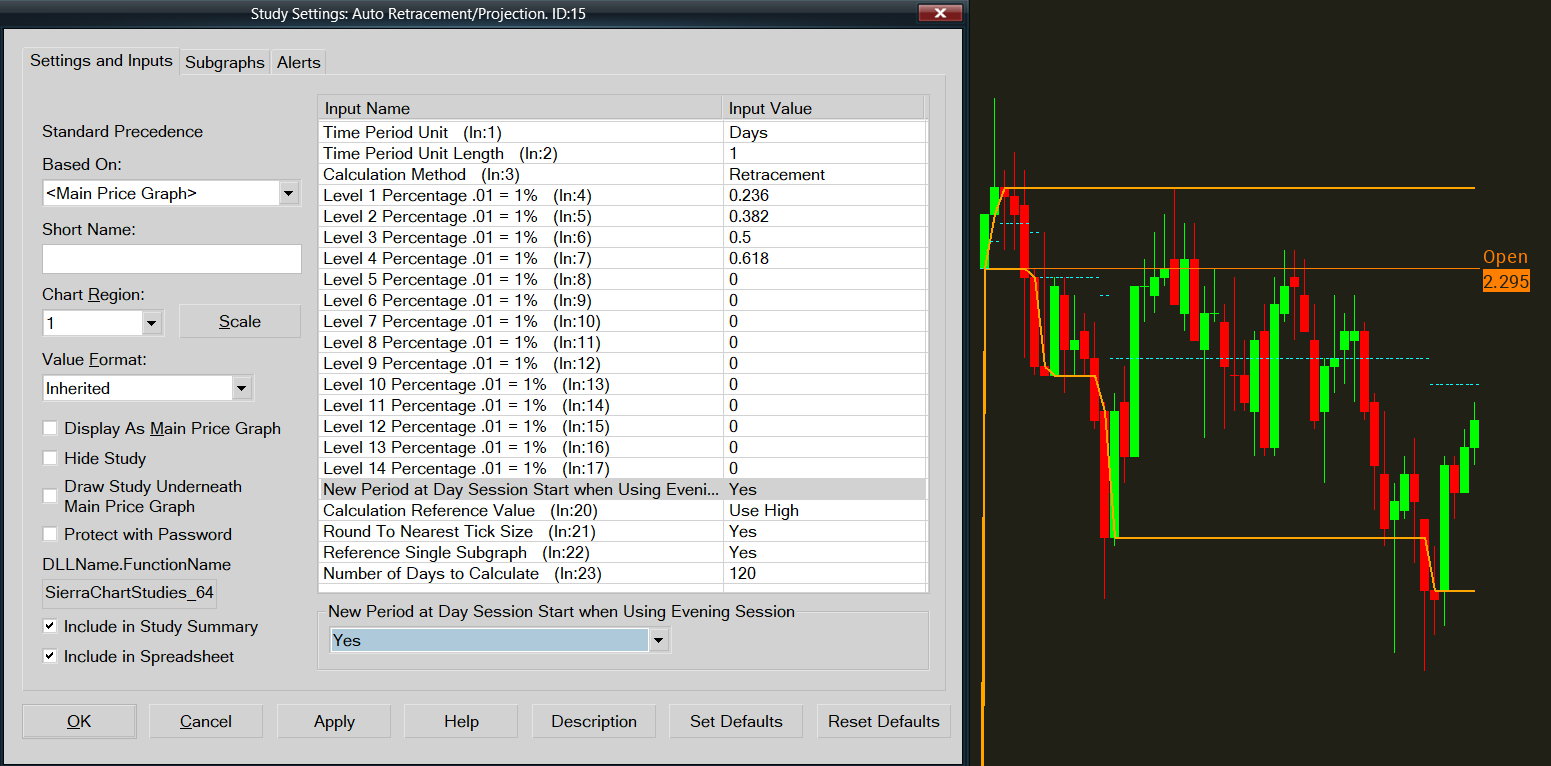
For this study IIUC--not guaranteed-- if the subgraph param "Reference to Single Subgraph" is set to "Yes", the values should reference Highs and/ or Lows when calculating the retracements. However they seem to be referencing bar opens.
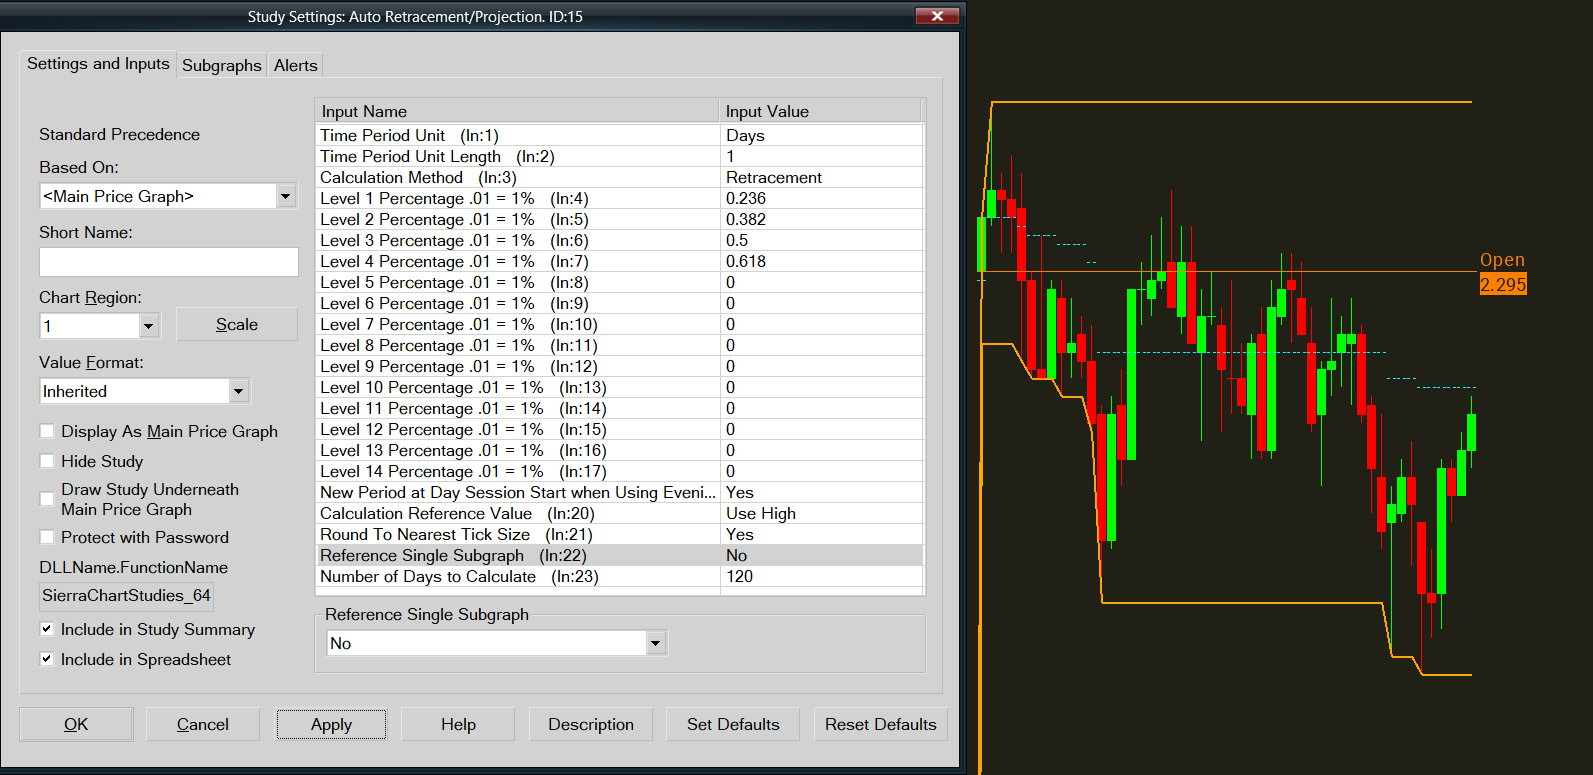
"No", which I believe is used to reference other studies in its calculations displays what I believe to be the "correct" values, clearly shown highs and lows.
What other study would this be referencing if not itself?
I do have a Daily Open study a few studies above if that's a clue.
Anyway, interesting to chart the highest/ lowest opens vs furthest extremes.
[Edit: I see the incorrect row is highlighted in the first pic. It should be "Reference Single Subgraph as the 2nd pic below it].
|


