Welcome to NexusFi: the best trading community on the planet, with over 150,000 members Sign Up Now for Free
Genuine reviews from real traders, not fake reviews from stealth vendors
Quality education from leading professional traders
We are a friendly, helpful, and positive community
We do not tolerate rude behavior, trolling, or vendors advertising in posts
We are here to help, just let us know what you need
You'll need to register in order to view the content of the threads and start contributing to our community. It's free for basic access, or support us by becoming an Elite Member -- see if you qualify for a discount below.
-- Big Mike, Site Administrator
(If you already have an account, login at the top of the page)
Hi guys
I trade stocks and began to use the platform of the Sierra,
I use it only Volume By Price Study
Please help me or tell me how to create an alert on my terms:
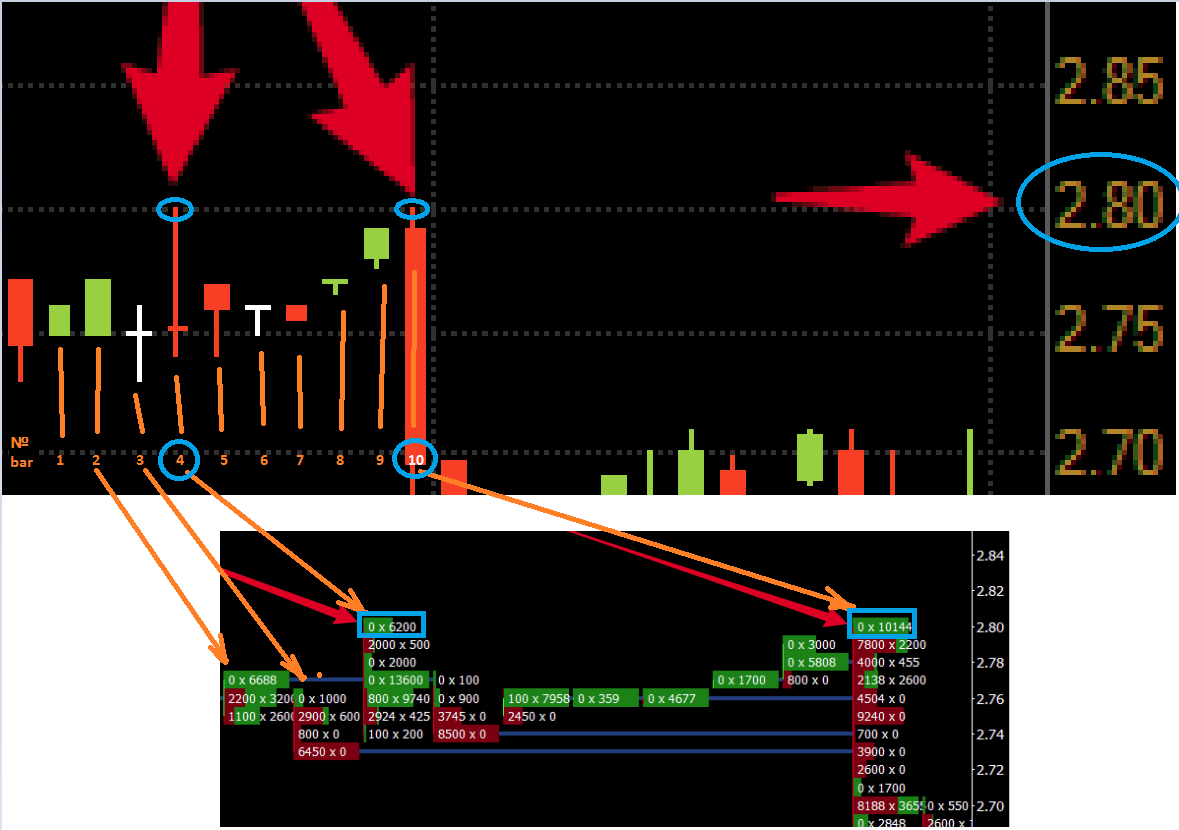
For example, see the screenshot below
The graph stock, bar period 1 min, two key bar (bar №4 and №10) have a local high at the same price, such as $ 2.80.
These bars the same Size of the bid = 0, and ofer different sizes such as more than 5000
How do I find a pattern, in which two local hi on the same price and on the higher price of these bars the size of the bid is equal to zero.
Сonditions:
1. bar period 1 min;
2. (Hi bar №4,10) => (Hi bar №1,2,3,4,5,6,7,8,9);
3. (Hi bar №4) = (Hi bar №10);
4. number of bars in the space between bars 4 and 10 should not exceed 15 (or 15 minutes),
that is, it is possible that the bars 4 and 10 will be located next to each other tightly.
that is permissible that the bars 4 and 10 are close
This model works well for actions and allows you to locate hidden sellers
who exhibit their hidden limit orders in Ofer on the same price level and
hold it. The options are as the breakdown of these levels and rebound from them.
Please suggest this pattern can be found with the aid of any indicators or
with the help of which it is better to start to do some study or spreadcheet?
whether it is possible to find this pattern without ACSIL language?
I look forward to any comments or suggestions which way to go and where to start
Can you help answer these questions from other members on NexusFi?
This is actually a complex alert condition. It would best be done using ACSIL.
It cannot be done using a spreadsheet study because BVAP and AVAP values are not output to spreadsheet studies.
Some form of this might be possible using the Special Functions of boolean alert formulas, and the native 'Highest High/Lowest Low Over N Bars' study, but you'd likely run into the character limit of 383. Study/Chart Alerts And Scanning - Sierra Chart
I had a coder (ref. was actually via Tom) writing a study so i could access bid/ask data. Limitation is 10 pricelevels, i use range bars on just 3 range. Not sure if it will work on minute data, where you have no knowledge over the range.
But... the moment (via simple alert conditions) i want to go 4-5 bars back in time i mostly will hit the MAX character limit....
I can share the study via PM if you think it may be of use.