NexusFi: Find Your Edge


Home Menu


Cumulative Volume Study


Discussion in Sierra Chart

Updated
      Top Posters
    1. looks_one omni72 with 12 posts (5 thanks)
    2. looks_two vegasfoster with 7 posts (7 thanks)
    3. looks_3 FGBL07 with 3 posts (6 thanks)
    4. looks_4 ChrisTinaBruce with 3 posts (1 thanks)
      Best Posters
    1. looks_one Jigsaw Trading with 3.5 thanks per post
    2. looks_two FGBL07 with 2 thanks per post
    3. looks_3 vegasfoster with 1 thanks per post
    4. looks_4 omni72 with 0.4 thanks per post
    1. trending_up 15,187 views
    2. thumb_up 36 thanks given
    3. group 13 followers
    1. forum 37 posts
    2. attach_file 8 attachments


Search this Thread

Cumulative Volume Study

  #1 (permalink)
 
omni72's Avatar
 omni72 
Tulsa, OK
 
Posts: 348 since Jan 2012
Thanks Given: 582
Thanks Received: 624

I'm looking for a way to do the following:
  1. track volume on a long-term time-of-day basis (i.e. avg or med cumulative vol at 8:30, 9:00, 9:30, etc)
  2. compare current time-of-day volume to the tracked avg / med (i.e. today's 8:30 vs 10-day avg at 8:30, etc)
  3. further compare current cumulative volume by day of week

Is anyone aware of a study that provides this type of data? I know I can come up with most of the data within a spreadsheet, but unsure how smoothly I can translate it into a viable SC study. Also, I don't know how I would pull off the day-of-week element.

Edit: I'm thinking it's possible to somehow re-engineer the Cumulative Sum Of Study to do these things but I wouldn't know how to go about it.

Thanks, in advance, for any thoughts on how this might be accomplished.

Take care -

omni

Luck is what happens when preparation meets opportunity. ~ Seneca
Started this thread Reply With Quote

Can you help answer these questions
from other members on NexusFi?
Request for MACD with option to use different MAs for fa …
NinjaTrader
ZombieSqueeze
Platforms and Indicators
NexusFi Journal Challenge - April 2024
Feedback and Announcements
My NT8 Volume Profile Split by Asian/Euro/Open
NinjaTrader
 
Best Threads (Most Thanked)
in the last 7 days on NexusFi
Retail Trading As An Industry
58 thanks
Battlestations: Show us your trading desks!
55 thanks
NexusFi site changelog and issues/problem reporting
48 thanks
What percentage per day is possible? [Poll]
31 thanks
GFIs1 1 DAX trade per day journal
29 thanks

  #2 (permalink)
 
Jigsaw Trading's Avatar
 Jigsaw Trading  Jigsaw Trading is an official Site Sponsor
 
Posts: 2,988 since Nov 2010
Thanks Given: 831
Thanks Received: 10,393

It's fairly easy to do.


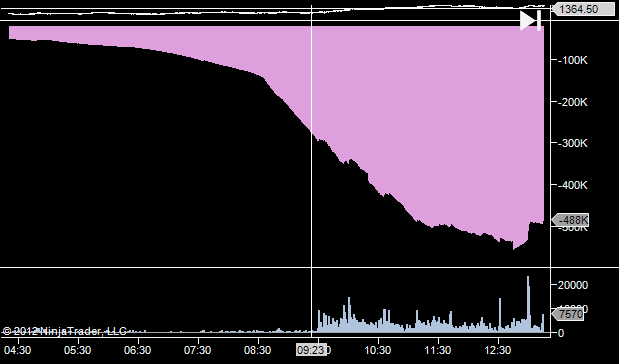
This shows relative cumulative volume for the time of day - you can see we started the afternoon with 488k less contracts traded than normal.

If it's moving down volume continues to be below average.
If it's moving up, volume is above average.
If it's flat, volume is now average.

You can have this moving down to 10am, for instance when there's a release everyone is waiting for. At that point it'l be below average. If it then flattens out, it'll still be below average in total but we will have reverted to mean.

It's direction that is key more than the actual number of contracts +/- for the day.

Indicator for Ninja is attached.

DT

Attached Files
Elite Membership required to download: JTRelativeVolume.cs
Visit my NexusFi Trade Journal Reply With Quote
The following 5 users say Thank You to Jigsaw Trading for this post:
  #3 (permalink)
 vegasfoster 
las vegas
 
Experience: Intermediate
Platform: Sierra Chart
Broker: Velocity/IB
Trading: 6E
Posts: 1,145 since Feb 2010
Thanks Given: 304
Thanks Received: 844


Omni correctly uses Sierra Chart. I haven't seen this. I can try to do it later in the week if someone doesn't beat me to it. You may have to send me a reminder PM if I don't respond by next week, really.

Reply With Quote
The following user says Thank You to vegasfoster for this post:
  #4 (permalink)
 FGBL07 
Oberhausen, Germany
 
Experience: Advanced
Platform: Sierracharts
Broker: Interactive Brokers/DTN IQFeed
Trading: Bund Future
Posts: 277 since Aug 2011
Thanks Given: 100
Thanks Received: 311

This has been discussed in the SC forum too.

I'm using a spreadsheet to display these data for 30-minute and 60-minute time slots. I use a 5-day average.

These data could easily be used to plot them on a chart.

In my opinion you need to plot three values:
  • current volume (no problem),
  • average/median volume for this time-slot and
  • a projected volume based upon the current volume.

For the bar on the hard right edge the first two are not enough, you want to compare current volume to its average/median.

I have not looked at volume differentiated by type of day. But since range shows some differences based upon type of day this may be true for volume too.

Attached Thumbnails
Click image for larger version

Name:	SNAG- 30.10.2012 08.50.00.png
Views:	427
Size:	59.0 KB
ID:	93441  
Follow me on Twitter Reply With Quote
  #5 (permalink)
 
omni72's Avatar
 omni72 
Tulsa, OK
 
Posts: 348 since Jan 2012
Thanks Given: 582
Thanks Received: 624


DionysusToast View Post
Indicator for Ninja is attached.

DT

Thanks for the input, but, as vegasfoster indicates, I'm using Sierra so I can't use Ninja indicators.


vegasfoster View Post
Omni correctly uses Sierra Chart. I haven't seen this. I can try to do it later in the week if someone doesn't beat me to it. You may have to send me a reminder PM if I don't respond by next week, really.

Sounds good And if all it takes is sending a reminder next week, you've got a deal!


FGBL07 View Post
This has been discussed in the SC forum too.

I'm using a spreadsheet to display these data for 30-minute and 60-minute time slots. I use a 5-day average.

These data could easily be used to plot them on a chart.

In my opinion you need to plot three values:
  • current volume (no problem),
  • average/median volume for this time-slot and
  • a projected volume based upon the current volume.

For the bar on the hard right edge the first two are not enough, you want to compare current volume to its average/median.

I have not looked at volume differentiated by type of day. But since range shows some differences based upon type of day this may be true for volume too.

Excellent effort @FGBL07 Am I mistaken or does your spreadsheet exclude cumulative time-slot volume information? For example, the 9:30 info will be the current and average volume during that 30 (or 60) min time-slot but not total volume for the day at the close of the 9:30 time-slot. Either way, thanks for your comments.

Also, you are absolutely correct - I have seen a few similar discussions on SC but haven't quite found the scenarios I'm looking for. It could just be a matter of not hitting on the right search terms yet.

Still tinkering away here .... but it won't hurt my feelings if @vegasfoster beats me to it

Luck is what happens when preparation meets opportunity. ~ Seneca
Started this thread Reply With Quote
  #6 (permalink)
 FGBL07 
Oberhausen, Germany
 
Experience: Advanced
Platform: Sierracharts
Broker: Interactive Brokers/DTN IQFeed
Trading: Bund Future
Posts: 277 since Aug 2011
Thanks Given: 100
Thanks Received: 311


omni72 View Post
..Am I mistaken or does your spreadsheet exclude cumulative time-slot volume information? For example, the 9:30 info will be the current and average volume during that 30 (or 60) min time-slot but not total volume for the day at the close of the 9:30 time-slot. ..

There is more in the spreadsheet than meets the eye. I do not look at the cumulated numbers but they are there and used for the daily forecast.

Attached Thumbnails
Click image for larger version

Name:	SNAG- 30.10.2012 15.30.14.png
Views:	342
Size:	77.6 KB
ID:	93474  
Follow me on Twitter Reply With Quote
  #7 (permalink)
 
omni72's Avatar
 omni72 
Tulsa, OK
 
Posts: 348 since Jan 2012
Thanks Given: 582
Thanks Received: 624


FGBL07 View Post
There is more in the spreadsheet than meets the eye.

Sneaky! Thanks for clarifying

Luck is what happens when preparation meets opportunity. ~ Seneca
Started this thread Reply With Quote
  #8 (permalink)
 
josh's Avatar
 josh 
Georgia, US
Legendary Market Wizard
 
Experience: None
Platform: SC
Broker: Denali+Rithmic
Trading: ES, NQ, YM
Posts: 6,215 since Jan 2011
Thanks Given: 6,740
Thanks Received: 18,114

I wrote this for Ninjatrader, which allowed for day of week and showed relative volume compared to an average or median. But in NT I did it by adding another data series; in SC I'm not sure this is the best way to go. I will use a little time off today that I would normally be trading and see what I can do, but SC code is still a little new to me so it may take a while.

Reply With Quote
The following 2 users say Thank You to josh for this post:
  #9 (permalink)
 
Big Mike's Avatar
 Big Mike 
Manta, Ecuador
Site Administrator
Developer
Swing Trader
 
Experience: Advanced
Platform: Custom solution
Broker: IBKR
Trading: Stocks & Futures
Frequency: Every few days
Duration: Weeks
Posts: 50,322 since Jun 2009
Thanks Given: 33,143
Thanks Received: 101,477

Shout out to @ktrader as well, his code magic always appreciated in such things.

Mike

We're here to help: just ask the community or contact our Help Desk

Quick Links: Change your Username or Register as a Vendor
Searching for trading reviews? Review this list
Lifetime Elite Membership: Sign-up for only $149 USD
Exclusive money saving offers from our Site Sponsors: Browse Offers
Report problems with the site: Using the NexusFi changelog thread
Follow me on Twitter Visit my NexusFi Trade Journal Reply With Quote
The following 2 users say Thank You to Big Mike for this post:
  #10 (permalink)
 
omni72's Avatar
 omni72 
Tulsa, OK
 
Posts: 348 since Jan 2012
Thanks Given: 582
Thanks Received: 624


josh View Post
I wrote this for Ninjatrader, which allowed for day of week and showed relative volume compared to an average or median. But in NT I did it by adding another data series; in SC I'm not sure this is the best way to go. I will use a little time off today that I would normally be trading and see what I can do, but SC code is still a little new to me so it may take a while.


Big Mike View Post
Shout out to @ktrader as well, his code magic always appreciated in such things.

Mike

Sounds good, fellas. Thanks for the interest and the efforts

My eventual goal is to be able to filter by day types. Take trend days as an example. If we see about 20% of the time the ES has a trend day, what typically happens the day after trend days? Is there a condition or day type that occurs 70% or 80% of the time in the session following a trend day? And what about the more common day types, like neutral or variation of a normal? Clearly, there is some subjectivity in defining day types (or opening types), but I'm thinking it could be valuable to have some idea of what frequently happens following certain market conditions.

Luck is what happens when preparation meets opportunity. ~ Seneca
Started this thread Reply With Quote
The following user says Thank You to omni72 for this post:


Last Updated on August 13, 2018


© 2024 NexusFi™, s.a., All Rights Reserved.
Av Ricardo J. Alfaro, Century Tower, Panama City, Panama, Ph: +507 833-9432 (Panama and Intl), +1 888-312-3001 (USA and Canada)
All information is for educational use only and is not investment advice. There is a substantial risk of loss in trading commodity futures, stocks, options and foreign exchange products. Past performance is not indicative of future results.
About Us - Contact Us - Site Rules, Acceptable Use, and Terms and Conditions - Privacy Policy - Downloads - Top
no new posts