NexusFi: Find Your Edge


Home Menu


Trading


Discussion in Trading Journals

Updated
      Top Posters
    1. looks_one aquarian1 with 952 posts (312 thanks)
    2. looks_two dario1 with 6 posts (2 thanks)
    3. looks_3 Big Mike with 4 posts (1 thanks)
    4. looks_4 xplorer with 4 posts (1 thanks)
      Best Posters
    1. looks_one Pariah Carey with 5 thanks per post
    2. looks_two Hanneke with 1.5 thanks per post
    3. looks_3 Ddawg with 1 thanks per post
    4. looks_4 aquarian1 with 0.3 thanks per post
    1. trending_up 187,127 views
    2. thumb_up 357 thanks given
    3. group 55 followers
    1. forum 997 posts
    2. attach_file 456 attachments


Search this Thread

Trading

  #341 (permalink)
 
aquarian1's Avatar
 aquarian1 
Point Roberts, WA, USA
 
Experience: Advanced
Platform: IB and free NT
Broker: IB
Trading: ES
Posts: 4,034 since Dec 2010
Thanks Given: 1,509
Thanks Received: 2,593

The Great Depression (10.25 min)
1929 Wall Street Stock Market Crash - YouTube

Peak Aug 27, 1029
Thursday panicky selling Oct 24 1929
Tuesday collapse Oct 29, 1929 "Black Tuesday"

..........
peace, love and joy to you
.........
Visit my NexusFi Trade Journal Started this thread Reply With Quote

Can you help answer these questions
from other members on NexusFi?
ZombieSqueeze
Platforms and Indicators
Better Renko Gaps
The Elite Circle
Increase in trading performance by 75%
The Elite Circle
Pivot Indicator like the old SwingTemp by Big Mike
NinjaTrader
MC PL editor upgrade
MultiCharts
 
Best Threads (Most Thanked)
in the last 7 days on NexusFi
Just another trading journal: PA, Wyckoff & Trends
27 thanks
Tao te Trade: way of the WLD
24 thanks
Diary of a simple price action trader
21 thanks
My NQ Trading Journal
14 thanks
GFIs1 1 DAX trade per day journal
9 thanks
  #342 (permalink)
 
aquarian1's Avatar
 aquarian1 
Point Roberts, WA, USA
 
Experience: Advanced
Platform: IB and free NT
Broker: IB
Trading: ES
Posts: 4,034 since Dec 2010
Thanks Given: 1,509
Thanks Received: 2,593

25 June 2012
1:30CT

Heading down


Nothing posted here is trading advice. Everything posted is educational information only. Futures and other trading involve the risk of loss. yada, yada, yada....

..........
peace, love and joy to you
.........
Visit my NexusFi Trade Journal Started this thread Reply With Quote
  #343 (permalink)
 
aquarian1's Avatar
 aquarian1 
Point Roberts, WA, USA
 
Experience: Advanced
Platform: IB and free NT
Broker: IB
Trading: ES
Posts: 4,034 since Dec 2010
Thanks Given: 1,509
Thanks Received: 2,593


25 June 2012


+3pts - sim


Nothing posted here is trading advice. Everything posted is educational information only. Futures and other trading involve the risk of loss. yada, yada, yada....

..........
peace, love and joy to you
.........
Visit my NexusFi Trade Journal Started this thread Reply With Quote
  #344 (permalink)
 
aquarian1's Avatar
 aquarian1 
Point Roberts, WA, USA
 
Experience: Advanced
Platform: IB and free NT
Broker: IB
Trading: ES
Posts: 4,034 since Dec 2010
Thanks Given: 1,509
Thanks Received: 2,593

25 June 2012
Looking at ETFs for Oil

Oil is in a downtrend.
You could buy one of these at a pullback to the trendline and then close the position at the resistance.

This is NOT to say that it WILL fail at the resistance only that resistance is a point of POTENTIAL trend change.
The way i play this is to sell, stand aside and what to see what happens at these points.
Clearly, we are far into the downtrend of oil and a better buy would be earlier, but I am looking at ETF versus futures in regards to a recent thought posed. I want to do trades in ETFs one for the ES one for CL and one for GC but in ETFs with an I of demonstrating chart reading and the potential of ETFs for traders with less time for trading.

My idea is to show that you could place trades about each three-four weeks and do very well.

I have created a shadow portfolio of $100,000 and placed $30,000 in each pot with $10,000 reserve.

----------
Chart of HOD


Chart of SCO


Nothing posted here is trading advice. Everything posted is educational information only. Futures and other trading involve the risk of loss. yada, yada, yada....

..........
peace, love and joy to you
.........
Visit my NexusFi Trade Journal Started this thread Reply With Quote
  #345 (permalink)
 
aquarian1's Avatar
 aquarian1 
Point Roberts, WA, USA
 
Experience: Advanced
Platform: IB and free NT
Broker: IB
Trading: ES
Posts: 4,034 since Dec 2010
Thanks Given: 1,509
Thanks Received: 2,593

25 June 2012
resold one at 1307


Nothing posted here is trading advice. Everything posted is educational information only. Futures and other trading involve the risk of loss. yada, yada, yada....

..........
peace, love and joy to you
.........
Visit my NexusFi Trade Journal Started this thread Reply With Quote
  #346 (permalink)
 
aquarian1's Avatar
 aquarian1 
Point Roberts, WA, USA
 
Experience: Advanced
Platform: IB and free NT
Broker: IB
Trading: ES
Posts: 4,034 since Dec 2010
Thanks Given: 1,509
Thanks Received: 2,593

It's dipsy - dodiling around the 1307 line so the last two are not looking so good.

I've put a but-to-close at 1306.25 for 2
and one at 1304.25

manipulators are in full control.

taking a break ....

..........
peace, love and joy to you
.........
Visit my NexusFi Trade Journal Started this thread Reply With Quote
  #347 (permalink)
 
aquarian1's Avatar
 aquarian1 
Point Roberts, WA, USA
 
Experience: Advanced
Platform: IB and free NT
Broker: IB
Trading: ES
Posts: 4,034 since Dec 2010
Thanks Given: 1,509
Thanks Received: 2,593

Closed them out.

Lazy L day confirmed.


..........
peace, love and joy to you
.........
Visit my NexusFi Trade Journal Started this thread Reply With Quote
  #348 (permalink)
 
aquarian1's Avatar
 aquarian1 
Point Roberts, WA, USA
 
Experience: Advanced
Platform: IB and free NT
Broker: IB
Trading: ES
Posts: 4,034 since Dec 2010
Thanks Given: 1,509
Thanks Received: 2,593

Tuesday, 26 June 2012
Time 12:03CT

In the wrap-up and preview of the upcoming week, done on Sunday night June 24, I say:


aquarian1 View Post
...
Next week:
I'm looking for possible bounce to 1337 area - if it fails here go short
Possible levels to bounce off of:
Then down to 1307 area - if it bounces close short. I don't think it will so in that case stay short. There is a trendline there and its about 50%.
It could find a place to bounce at 1298 to1300 level - which is old lows and 5/8 retrace level - if it bounces close short.
.....
Basically stay short green downtrend line.

Here you have been shown once again tradeable levels forecasted with precision coming to fruition.

Chart reading takes practice and skill. But as with any craft it can be mastered. Beginners will read a little article and then try it and fail. This is somewhat like reading a book on playing the piano and then trying it without practising and failing and then saying "playing the piano doesn't work." Anything skill worth acquiring usually takes practise.

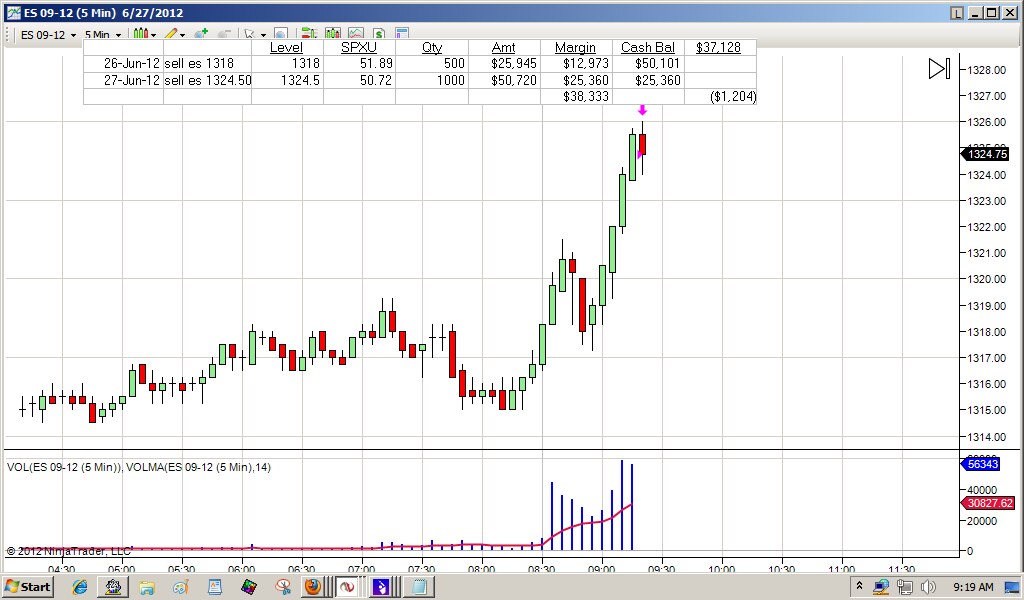
So we saw last week the estimation of the high at 1355.50 the 5/8 level and the high made at 1357. We have demonstrated it is tradeable with a 24% profit on SPUX in one week with 3 trades ( ). Buying on Monday's open selling and reversing at the estimation level and closing at the low. (SPUX is reversed so above is in terms of ES).

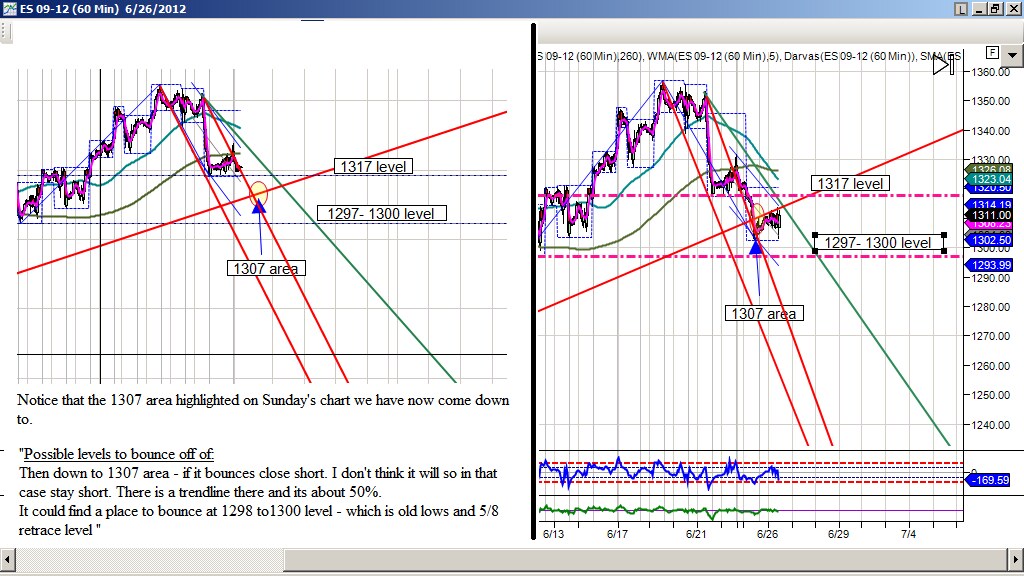
Now we have said a fall to 1307 level and possibly 1298 to 1300. You can see this happen on the chart.
(and yesterdays low of 1302.5). Very tradeable at the open was 1314.75. MFbreakout did trade it. Once you are short the second end is only a question of how much profit. You can see in yesterday's intraday posts I first idneitfied that the low was approaching (fan forming: ) I identified when the Low of the day was in place ( ). So you recoginized the low was 1307 to the 1300 and then during the trading day you can identify the low more precisely (using indicators and speed lines.)

There are none so blind as those who will not see.


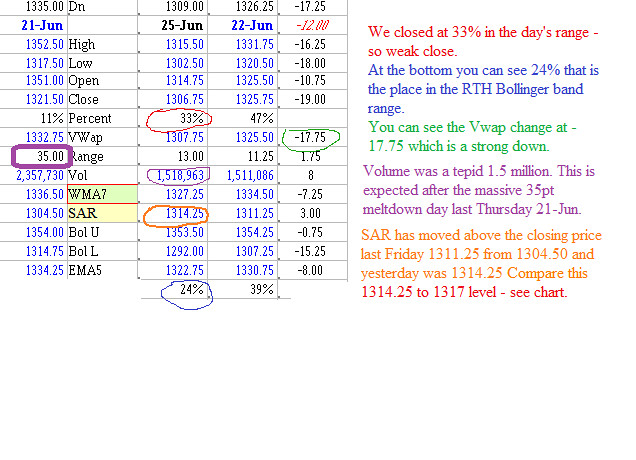
Yesterday, Monday 25 June 2012, it:
opened gap down (-5)
fell from 1315.50 at 8:30 to 1302.50 @ 11:01
bounced to 1310.25 at 14:26
and drooped off to the close at 1306.75

Open: 1314.75
Close: 1306.75

Nothing posted here is trading advice. Everything posted is educational information only. Futures and other trading involve the risk of loss. yada, yada, yada....


..........
peace, love and joy to you
.........
Visit my NexusFi Trade Journal Started this thread Reply With Quote
  #349 (permalink)
 
aquarian1's Avatar
 aquarian1 
Point Roberts, WA, USA
 
Experience: Advanced
Platform: IB and free NT
Broker: IB
Trading: ES
Posts: 4,034 since Dec 2010
Thanks Given: 1,509
Thanks Received: 2,593

bot 1/3 of line for ETF example


Nothing posted here is trading advice. Everything posted is educational information only. Futures and other trading involve the risk of loss. yada, yada, yada....

..........
peace, love and joy to you
.........
Visit my NexusFi Trade Journal Started this thread Reply With Quote
  #350 (permalink)
 
aquarian1's Avatar
 aquarian1 
Point Roberts, WA, USA
 
Experience: Advanced
Platform: IB and free NT
Broker: IB
Trading: ES
Posts: 4,034 since Dec 2010
Thanks Given: 1,509
Thanks Received: 2,593


Wednesday 27 June 2012 9:20CT

Bot 1000 more


Nothing posted here is trading advice. Everything posted is educational information only. Futures and other trading involve the risk of loss. yada, yada, yada....

..........
peace, love and joy to you
.........
Visit my NexusFi Trade Journal Started this thread Reply With Quote


Last Updated on January 2, 2021


© 2024 NexusFi™, s.a., All Rights Reserved.
Av Ricardo J. Alfaro, Century Tower, Panama City, Panama, Ph: +507 833-9432 (Panama and Intl), +1 888-312-3001 (USA and Canada)
All information is for educational use only and is not investment advice. There is a substantial risk of loss in trading commodity futures, stocks, options and foreign exchange products. Past performance is not indicative of future results.
About Us - Contact Us - Site Rules, Acceptable Use, and Terms and Conditions - Privacy Policy - Downloads - Top
no new posts