NexusFi: Find Your Edge


Home Menu


Favorite technical/chart setups


Discussion in Traders Hideout

Updated
      Top Posters
    1. looks_one kareem40 with 4 posts (4 thanks)
    2. looks_two JonnyBoy with 2 posts (2 thanks)
    3. looks_3 Miesto with 2 posts (5 thanks)
    4. looks_4 CannonTrading with 2 posts (2 thanks)
      Best Posters
    1. looks_one Miesto with 2.5 thanks per post
    2. looks_two kareem40 with 1 thanks per post
    3. looks_3 JonnyBoy with 1 thanks per post
    4. looks_4 CannonTrading with 1 thanks per post
    1. trending_up 3,061 views
    2. thumb_up 16 thanks given
    3. group 10 followers
    1. forum 14 posts
    2. attach_file 3 attachments


Search this Thread

Favorite technical/chart setups

  #11 (permalink)
 
JonnyBoy's Avatar
 JonnyBoy 
Montreal, Quebec
 
Experience: Advanced
Platform: NinjaTrader 8
Broker: Kinetick
Trading: ES
Posts: 1,561 since Apr 2012
Thanks Given: 706
Thanks Received: 3,857

For sure. It wasn't a criticism and I understand where you are coming from. Nice looking chart.

--------------------------------------------------------
- Trade what you see. Invest in what you believe -
--------------------------------------------------------
Reply With Quote
Thanked by:

Can you help answer these questions
from other members on NexusFi?
Increase in trading performance by 75%
The Elite Circle
Trade idea based off three indicators.
Traders Hideout
How to apply profiles
Traders Hideout
Exit Strategy
NinjaTrader
MC PL editor upgrade
MultiCharts
 
Best Threads (Most Thanked)
in the last 7 days on NexusFi
Just another trading journal: PA, Wyckoff & Trends
35 thanks
Tao te Trade: way of the WLD
24 thanks
Bigger Wins or Fewer Losses?
19 thanks
GFIs1 1 DAX trade per day journal
16 thanks
Spoo-nalysis ES e-mini futures S&P 500
14 thanks
  #12 (permalink)
 
CannonTrading's Avatar
 CannonTrading   is a Vendor
 
Posts: 216 since Mar 2013
Thanks Given: 77
Thanks Received: 183


TickedOff View Post
what are chart/technical setups that work the best for you? Could you include pics of what they look like/what conditions are optimal?

I like to use oversold/ overbought indicators personally with some custom indicators I created.
here is a screen shot: https://www.cannontrading.com/tools/support-resistance-levels/wp-content/uploads/2019/08/image1.png

PM with any questions about Cannon Trading (800) 454-9572 (310) 859-9572. Trading commodity futures, forex and options involves substantial risk of loss. The recommendations contained in this post are of opinion only and do not guarantee any profits. These are risky markets and only risk capital should be used. Past performance is not necessarily indicative of future results.
Follow me on Twitter Reply With Quote
Thanked by:
  #13 (permalink)
 
kareem40's Avatar
 kareem40 
Dallas, TX
Legendary TradeTheBar
 
Experience: Intermediate
Platform: NT, TS
Broker: IB, Oanda
Trading: ES, MES, MNQ, MYM
Posts: 725 since May 2010
Thanks Given: 1,947
Thanks Received: 921


JonnyBoy View Post
For sure. It wasn't a criticism and I understand where you are coming from. Nice looking chart.

No worries, was not taken as such
Thanks
K

Follow me on Twitter Visit my NexusFi Trade Journal Reply With Quote
  #14 (permalink)
 
teamtc247's Avatar
 teamtc247 
Fairburn, Georgia
 
Experience: None
Posts: 980 since Dec 2012
Thanks Given: 644
Thanks Received: 1,116

Elliot Wave ABC corrections 5-3-5 or 3-3-5 ZIG Zag or the Flats. I don't think about the type.

Process oriented goals #1.
Visit my NexusFi Trade Journal Reply With Quote
Thanked by:
  #15 (permalink)
 
CannonTrading's Avatar
 CannonTrading   is a Vendor
 
Posts: 216 since Mar 2013
Thanks Given: 77
Thanks Received: 183


TickedOff View Post
what are chart/technical setups that work the best for you? Could you include pics of what they look like/what conditions are optimal?


One more to share.....

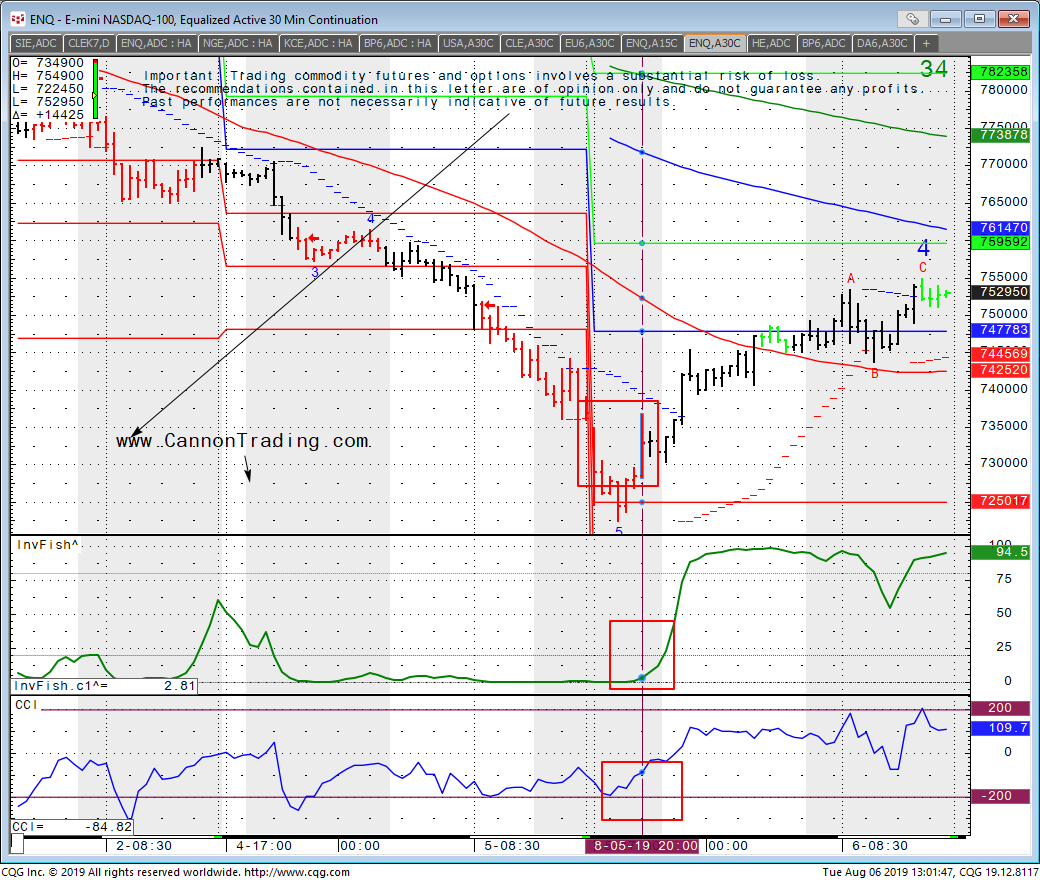
The swing turning points based on pattern, price support/resistance, and time-cycle ratios are especially important when the market is overbought or oversold. I use two indicators for overbought or oversold. First if the commodity-channel-index(5) is above 100 it indicates overbought. If below -100 it indicates oversold. Second the rsi(2) is averaged over the most recently completed two days. If above 85 it indicates overbought, below 15 indicates oversold. Both of these indicators must agree for the market to be overbought or oversold. i.e. a reversal signal on the swing trade time frame of one to two weeks. Each evening my software scans the futures and forex markets for overbought and oversold conditions. Beware that if the rsi(2) indicator averaged over the recently completed two days is above 99 or below 1. The momentum is so powerful it should be considered a continuation signal.

PM with any questions about Cannon Trading (800) 454-9572 (310) 859-9572. Trading commodity futures, forex and options involves substantial risk of loss. The recommendations contained in this post are of opinion only and do not guarantee any profits. These are risky markets and only risk capital should be used. Past performance is not necessarily indicative of future results.
Follow me on Twitter Reply With Quote
Thanked by:


Last Updated on August 6, 2019


© 2024 NexusFi™, s.a., All Rights Reserved.
Av Ricardo J. Alfaro, Century Tower, Panama City, Panama, Ph: +507 833-9432 (Panama and Intl), +1 888-312-3001 (USA and Canada)
All information is for educational use only and is not investment advice. There is a substantial risk of loss in trading commodity futures, stocks, options and foreign exchange products. Past performance is not indicative of future results.
About Us - Contact Us - Site Rules, Acceptable Use, and Terms and Conditions - Privacy Policy - Downloads - Top
no new posts