Welcome to NexusFi: the best trading community on the planet, with over 150,000 members Sign Up Now for Free
Genuine reviews from real traders, not fake reviews from stealth vendors
Quality education from leading professional traders
We are a friendly, helpful, and positive community
We do not tolerate rude behavior, trolling, or vendors advertising in posts
We are here to help, just let us know what you need
You'll need to register in order to view the content of the threads and start contributing to our community. It's free for basic access, or support us by becoming an Elite Member -- see if you qualify for a discount below.
-- Big Mike, Site Administrator
(If you already have an account, login at the top of the page)
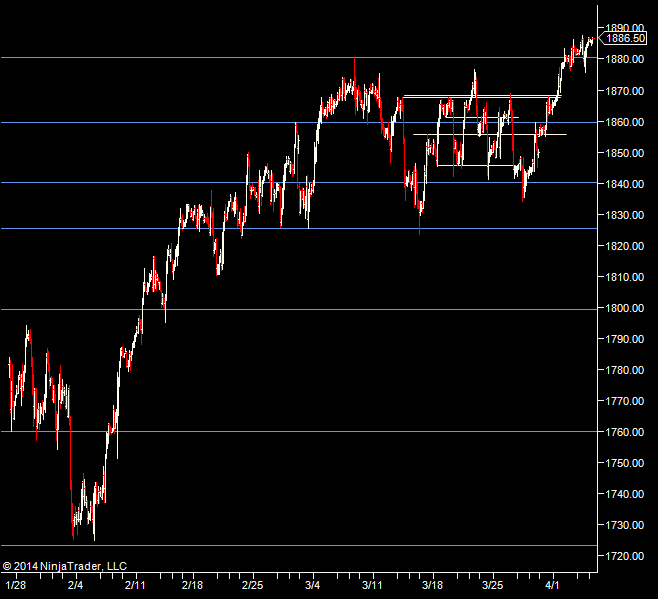
Last day of the month. So a push up may be on the cards.
Once again we are stalled at the 59.50 area. What I'm looking for today is a push through there towards 1880 or a push to one of the downside references 1839.50 or 1825.25. I'll be looking for shorts below 59.50 and longs above.
We are just at the top of last weeks value area. Downside looks likely to be choppy from here down to 1840 and above 1864, it looks like we could have a runner.
We do have a gap up from Fridays close but a gap in the sense of opening above Fridays range. 1850.75 is where we retraced to after moving down into Thursdays range but not getting to Thursdays VAH. Longs will want to see 50.75 hold and if not 48.25 and I'll be wary of those levels if I'm still short.
Weekly Numbers
Range - 1834 -> 1868.75
Value 1841.50 -> 1859.50
S1 - 1833.50, R1 - 1868.25
Daily Numbers
Range - 1841.25 (globex)/1845 (pit) -> 1859.50
Value - 1849.25 -> 1857.75
Globex - 1855 -> 1858.75
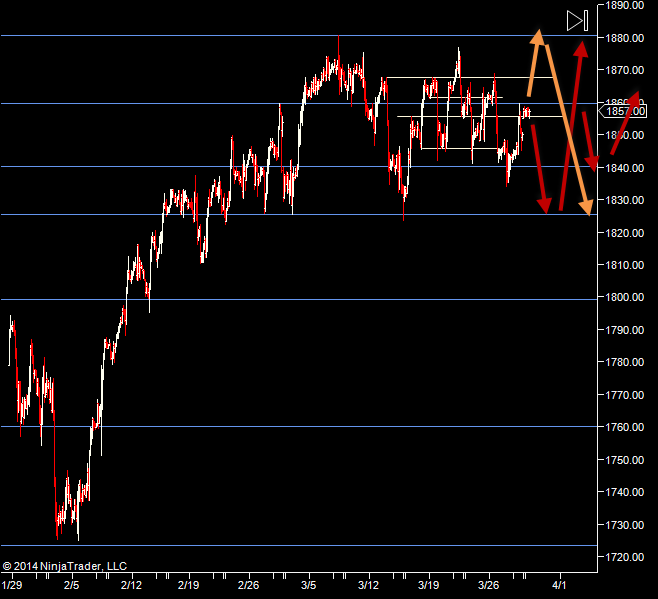
Back up towards the highs again. So a simple day today - can we get to the high this time or are we going to collapse back down towards 1839.50.
As of writing, we are at the 1868 area which has been acting as resistance for a while, although I still see it as a minor level. We are above the worst of the chop. We have some news at 10am and if it does look bullish, I can see the potential for both pace and interest to push it to 1880.
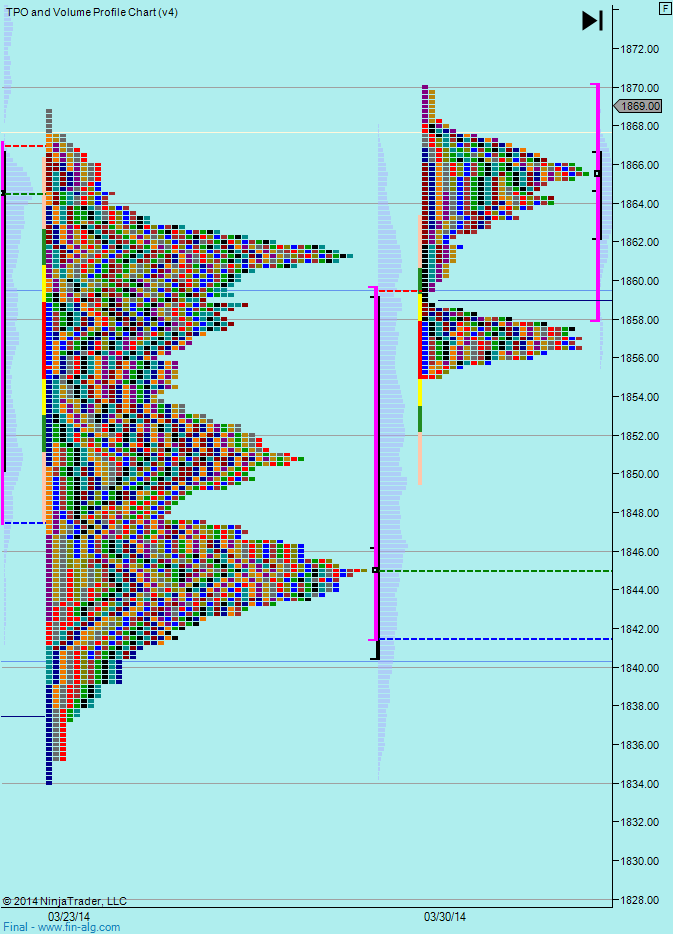
The weekly profile isn't showing us much more - we can see we have been trading above the 1864 level discussed yesterday and that was an area we thought would be more fluid.
Saying that, the range wasn't very big yesterday but we did see a move to Fridays pit session high and then buyers step in. For today, I'll be looking for something similar. A move to a downside reference where buyers will jump in. If I see that, I expect the move to have legs.
If we do break below yesterdays pit session low, then I'm cautious down to 59.50 and bearish below it.
Weekly Numbers
Range - 1834 -> 1868.75
Value 1841.50 -> 1859.50
S1 - 1833.50, R1 - 1868.25
Daily Numbers
Range - 1855 (globex)/1859.50 (pit) -> 1868
Value - 1862.50 -> 1866
Globex - 1862.25 -> 1870
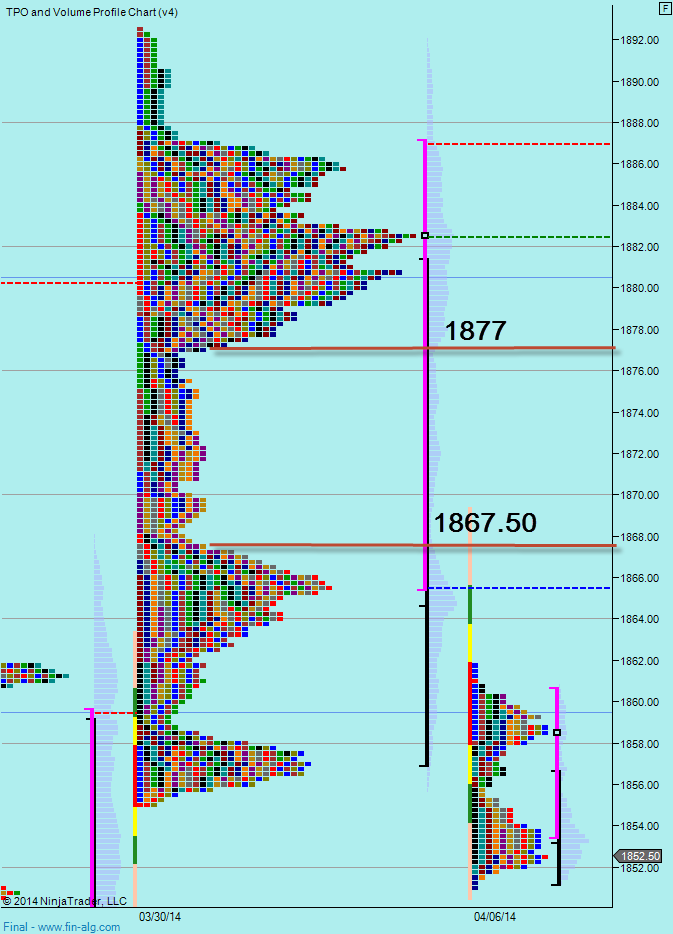
Well, that's a relief, we finally got our high. Not yesterday though - but overnight. So first order of the day is if we can hold onto that. The old high was 1880.50 and at this point it seems to be asking a lot for that to hold on a retrace down from here. 1867.50 does look like a potential candidate and I'll be watching that today.
In terms of today, I don't really see anything else worth considering but a hold of this high or a failure down. We can see the potential downside references for continued rangebound behavior - 1859.50, 1839.50, 1825.25.
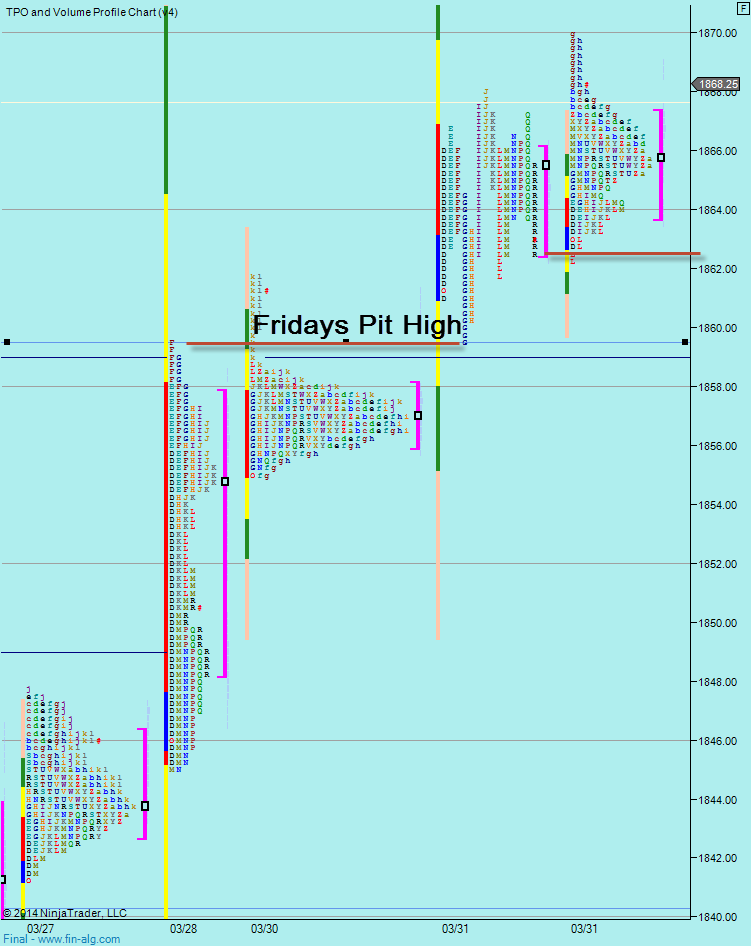
Yesterday we said "Saying that, the range wasn't very big yesterday but we did see a move to Fridays pit session high and then buyers step in. For today, I'll be looking for something similar. A move to a downside reference where buyers will jump in"
Yesterday pit session, we did move down through the Globex high before buyers stepped in. Pretty much following what happened on Monday. So today, instead of looking for 1880.25 to hold from above, I favor a downside test. Both from the perspective of wanting a long but also in terms of switching to short bias. So I won't be saying that 1880.25 it's reversing to bottom of the range until we clear yesterdays value low. If we break that, I'll be thinking this whole move up through the highs is just a tease.
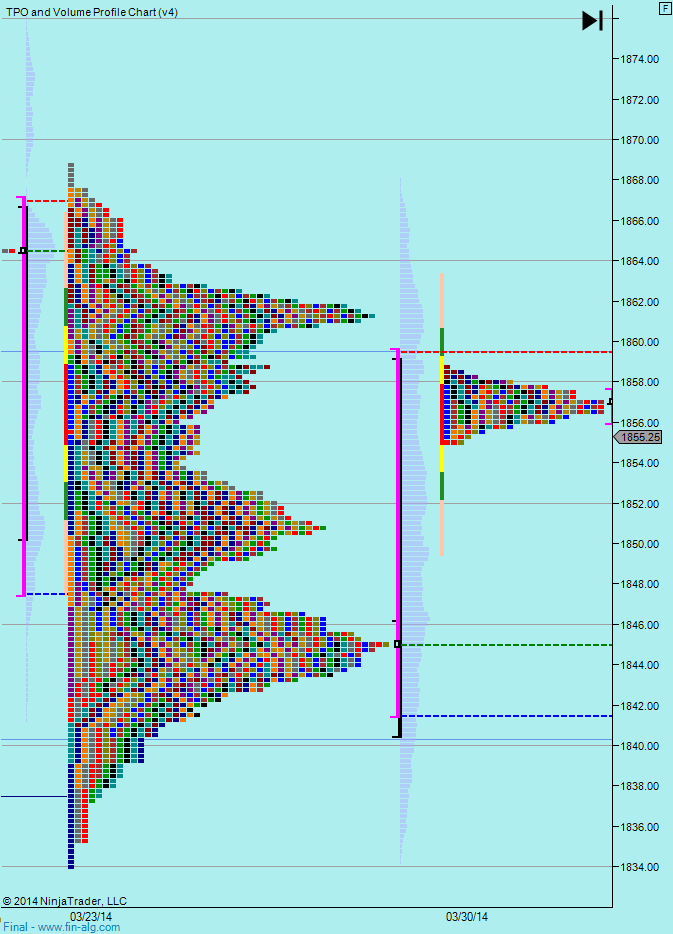
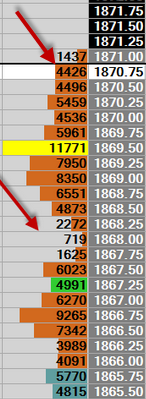
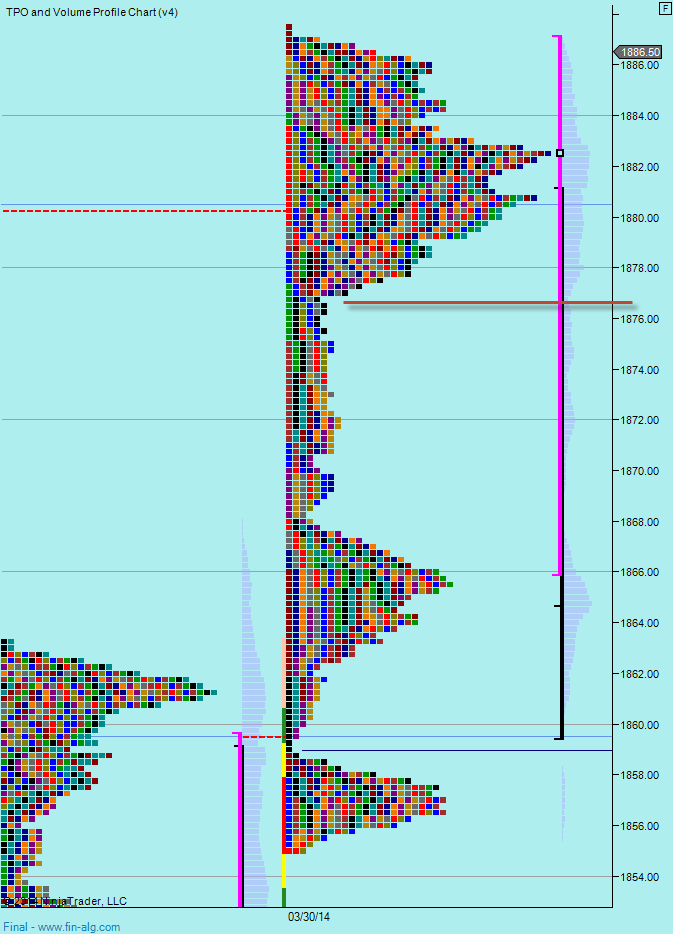
In terms of the downside references yesterday, we had some interesting developments off the volume profile. The above was taken at 9:29:40 - We can see the 1868 level with very few contracts traded.
At 70.75, just prior to the open a lot of sellers sold into that price - about 3500 sell market orders, lots of size and it held. Quite a rare thing to see in the Globex session. That held on the first test and we couldn't get as low as 68 on the next push down. So do keep an eye on the overnight volume profile as your downside tests might just come from there.
Weekly Numbers
Range - 1855 -> 1883.50
Value 1860.50 -> 1880.50
S1 - 1833.50, R1 - 1868.25
Daily Numbers
Range - 1862.25(globex)/1869.25 (pit) -> 1878.25
Value - 1870.50 > 1875.50
Globex - 1877 -> 1883.50
We are pretty much where we were same time yesterday. We are about in the same place So let's just repeat.
Well, that's a relief, we finally got our high. Not yesterday though - but overnight. So first order of the day is if we can hold onto that. The old high was 1880.50 and at this point it seems to be asking a lot for that to hold on a retrace down from here. 1867.50 does look like a potential candidate and I'll be watching that today.
In terms of today, I don't really see anything else worth considering but a hold of this high or a failure down. We can see the potential downside references for continued rangebound behavior - 1859.50, 1839.50, 1825.25.
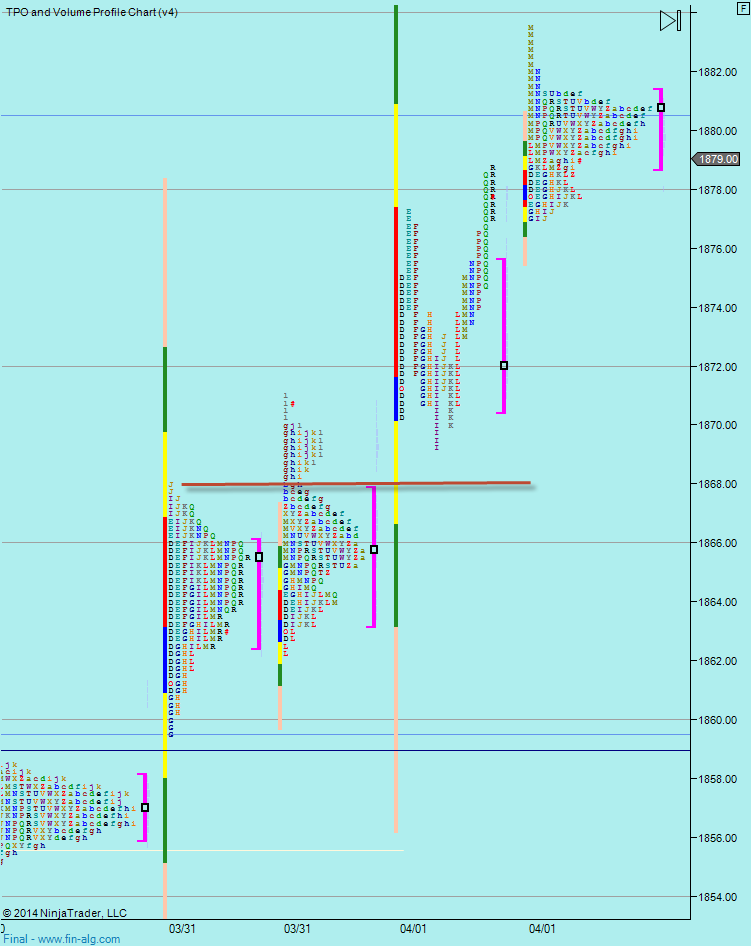
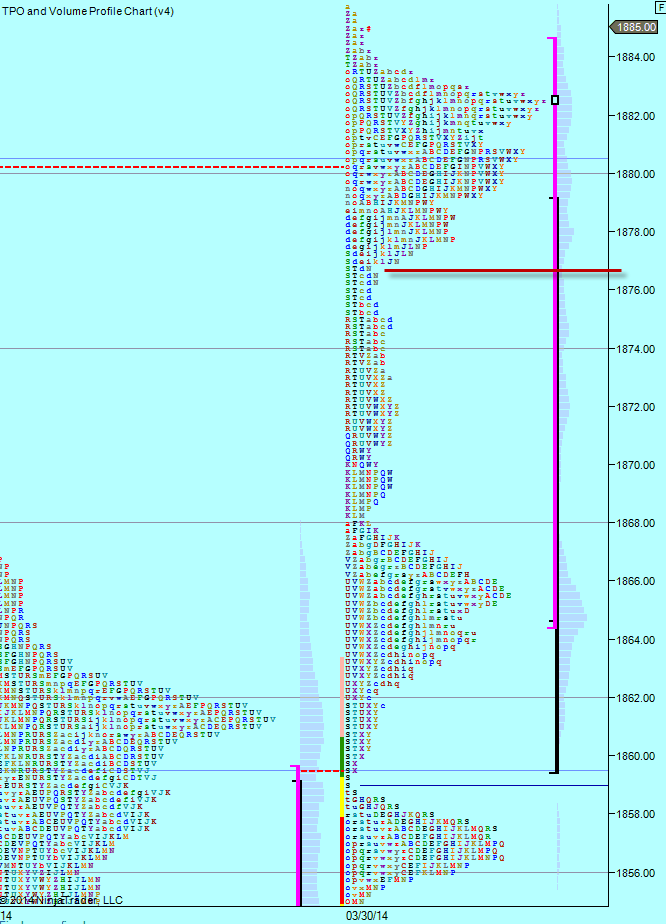
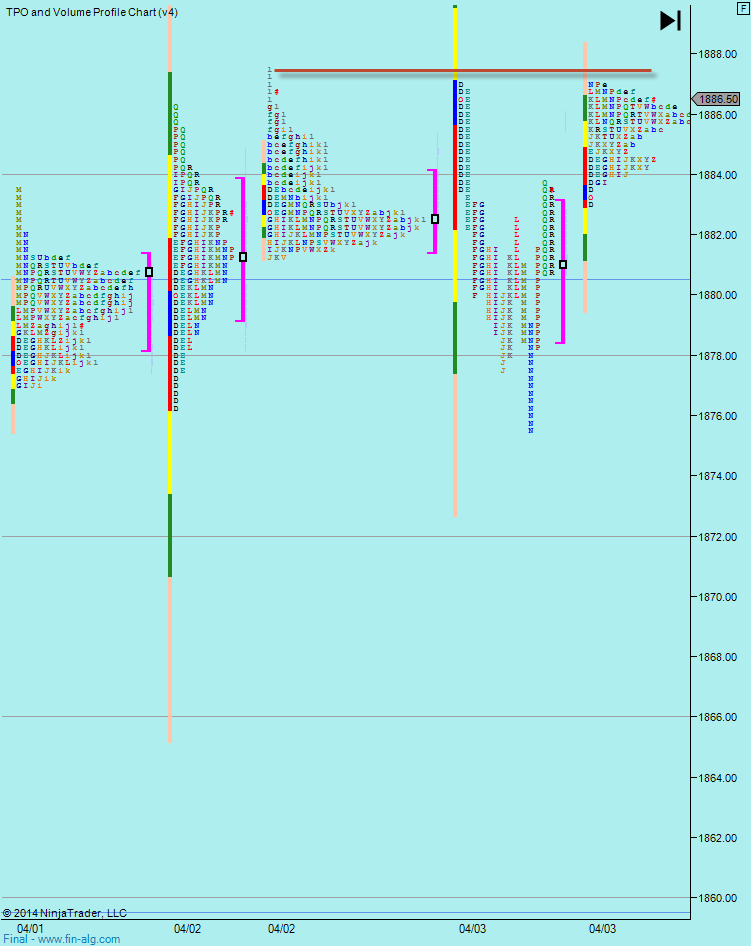
We can see a few distributions on the way up this week. The upper one has a low of 1876.75, so that's a level we can look at to hold if tge 80.50 does break.
Yesterday we said:
Yesterday we said "Saying that, the range wasn't very big yesterday but we did see a move to Fridays pit session high and then buyers step in. For today, I'll be looking for something similar. A move to a downside reference where buyers will jump in"
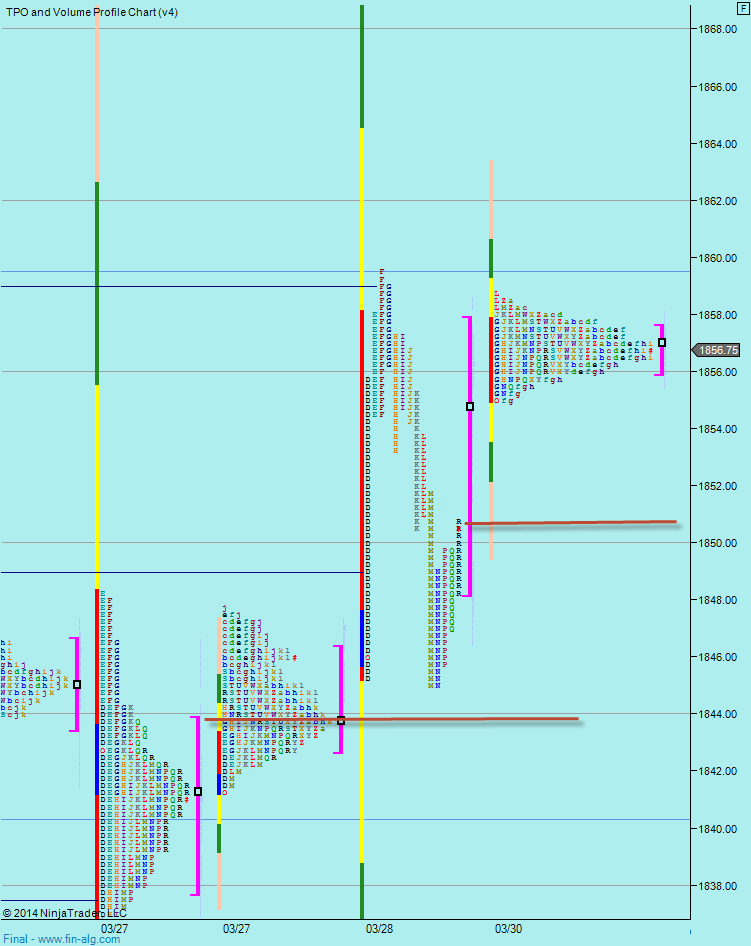
The red horizontal line was Tuesdays Value high. On Wednesday we pushed down to within a few ticks of that ant then buyers jumper in. So sure - range wasn't great but it's still moving up off downside tests.
So again, look for the downside test. If we see yesterdays low break, then we may see a decent push downwards but right now - people are buying the dip. I almost feel like I'm jinxing it just by saying that!
Weekly Numbers
Range - 1855 -> 1886.25
Value 1864.75 -> 1885.0
S1 - 1833.50, R1 - 1868.25
Daily Numbers
Range - 1876.25 -> 1886.25
Value - 1879.25 -> 1883.75
Globex - 1881.25 -> 1885.25
Well - still pretty much in the same place but a more convincing break of 1880.50 yesterday. It really feels like everyone is waiting to see what everyone else is going to do. The past 3 days volume has been around 1.2 Million contracts which is fairly light. We need a break one way or the other and perhaps the numbers at 8:30 will help us out a little.
I am completely neutral biased at this point.
We can see that most of the action this week has been above 1877. We had a poke through that yesterday but buyers did step in. So I'll be looking to see what happens if we break it again today.
It seems that the 1887.50 area is proving tough to crack and so a test of that today that fails would be an interesting short. Yesterdays low was just a few ticks below Wednesdays low so there is a good chance we will rotate around Wednesday/Thursdays range today.
Yesterdays Value High has held in Globex and if it holds in the pit session, that's more bullish and I'd expect 1887.50 to break.
Weekly Numbers
Range - 1855 -> 1887.50
Value 1865-> 1887
S1 - 1833.50, R1 - 1868.25
Daily Numbers
Range - 1875.50 -> 1887 (pit)/1887.50 (globex)
Value - 1878.50 -> 1883
Globex - 1883-> 1887
Non Farm Payroll gave us a good move on Friday. We took a look up to the Globex high in the pit session, couldn't get through it and then sellers came in. Volume had been sparse last week but we got 2.5 million on Firday
Typically, the Monday following NFP can be pretty lousy in terms of range. Still, we do have the chance of a "snap back" today if buyers come in and the shorts start to feel the squeeze.
If we don't snap back today, then I can see us working our way back down towards the bottom of the range - 1839.50 or 1825.25.
I'll be looking above to see if 59.50 acts as resistance, if it does, then I think we go down. Similarly I'll be looking for Fridays lows to see if they hold in the pit session and if they do expect buyers to jump in - but not with any real opinion on how far they can take it.
Looking at last week, we have a lower traded area between 67.50-77, so again I'll be looking at those prices to see if they act as resistance. 67.50 is also one of our price levels (see below). Looking at the 2 hour chart above, we are in a chop zone but normally looking at the profile, I'd expect 67.50-77.00 to provide more easy movement if we do move up.
So - a snap back or a bit of chop are my 2 most likely scenarios. We could carry on straight down of course. Globex inventory is short so a correction upside off the open could spur a move up.
Not the easiest day to call. So I'll not be in a great hurry to get into a trade.
Weekly Numbers
Range - 1855 -> 1892.50
Value 1865.50-> 1887
S1 - 1846.50, R1 - 1883
Daily Numbers
Range - 1855.75 -> 1892.25
Value - 1856.50-> 1881.50 (but pretty meaningless on a day like Friday)
Globex - 1850.25 -> 1861.75
Well - my 2 preferred scenarios for yesterday fell by the wayside and we carried on down. We have a level just below at 1825.25 and we have March low just below at 1823.50. So we either stop here and turn back up or it's down to test 1799.25.
The line above us at 39.50 is a line in the sand, we can see it's already rotated around it a little, so if that's resolved one way or the other off the pit open, we should have our bias.
Note that on the last push down through 39.50 (127th March) - we got as far as 1834 - so people will have an eye on that too..
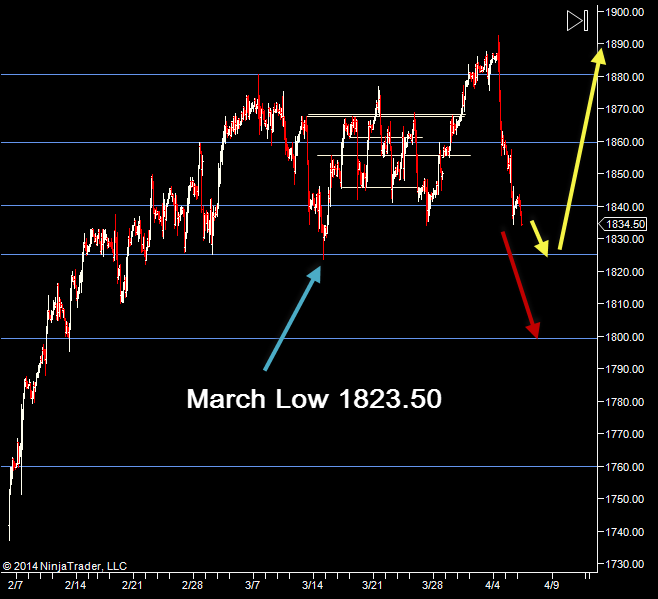
Not really much on the weekly profile from my perspective, I will be watching the lower distribution at 1837-1843 but I think it's a reach to say we'll rotate there at this point.
The split globex/pit profile is a bit more interesting. We can see that after the drop yesterday we managed to reach 1846, so I think that's worth watching if we do get through 39.50 level. Other than that, the usual numbers are in play.
Weekly Numbers Range - 1855 -> 1892.50
Value 1865.50-> 1887
S1 - 1846.50, R1 - 1883
Daily Numbers
Range - 1834.50 -> 1857.50 (globex)/ 1861.75 (pit)
Value - 1837.25-> 1849.75
Globex - 1833.25 -> 1843.50
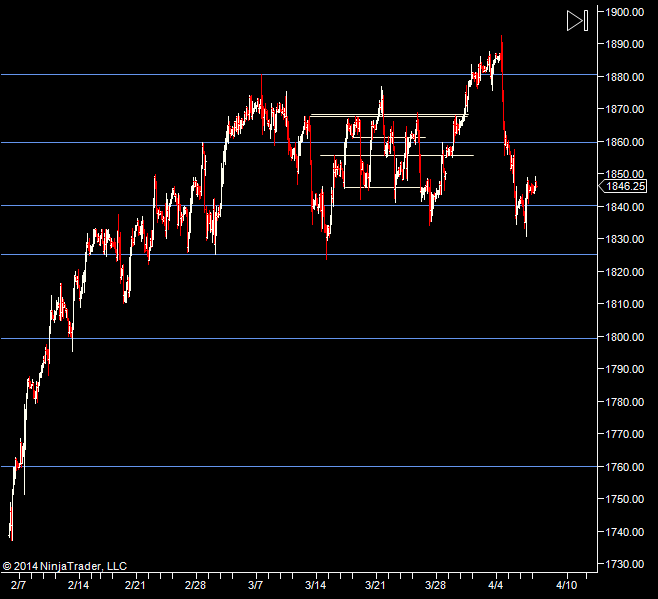
We didn't make it as low as our 1825.25 level yesterday but we did see buyers step in and got back up through the 1839.50 level.
Volume yesterday was a little lower than the prior 2 days at 1.8 million but that's still fairly decent.
So the question to be answered today is simple - "are we now done in the probe to the bottom of the range and looking at 1890 again or will sellers come in for another leg down?".
I don't think it'll take much to spook the longs, so I think it's a case of figuring out where longs will bail out for another leg down.
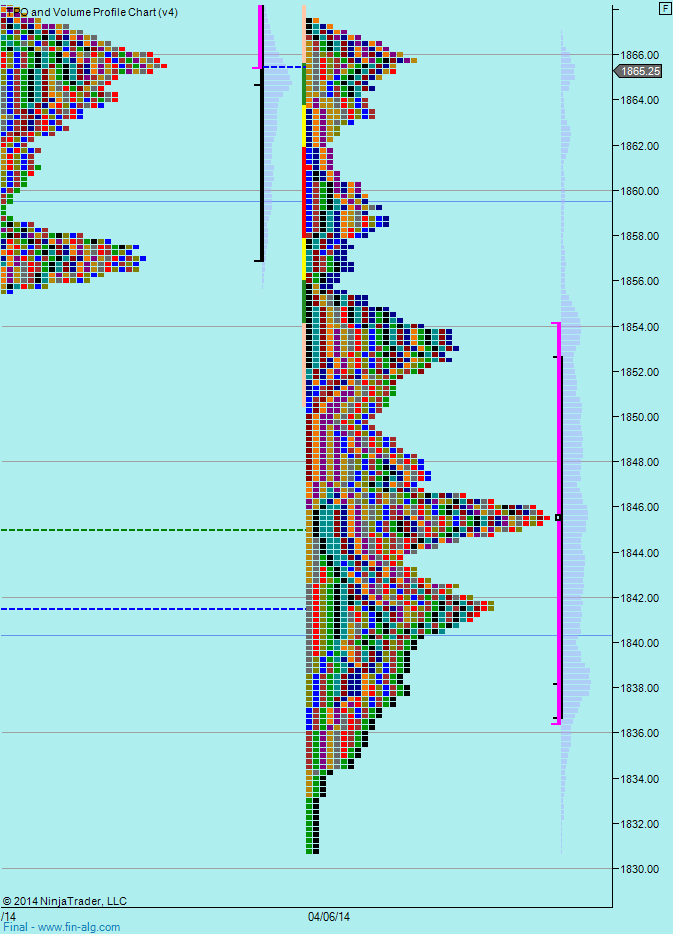
We can see value for the week is around a fairly nicely distributed bulge in the bottom of the profile. So if weekly value breaks either side, we could see people joining that move. So I'm looking to this weeks value area to see if each side holds or folds.
The first order of the day is the 1841 level highlighted above. Bulls will want that to hold. If that does break there's a second chance level below at the VAL 1839.25 but if that breaks I'd expect to at least test yesterdays low. To the upside we have traded briefly above yesterdays high/VAH but not managed to stay above it yet.
So into today - looking at yesterdays value first as well as 1841 level. I'll be short biased below 39.25 and long biased above 1849 (weekly VAH/globex high). Also looking for these levels to hold for an earlier entry with caution.
Weekly Numbers
Range - 1830.76 -> 1861.75
Value 1834.50 -> 1849
S1 - 1846.50, R1 - 1883
Daily Numbers
Range - 1830.75 -> 1849
Value - 1839.25 -> 1847.75
Globex - 1843.75 -> 1849
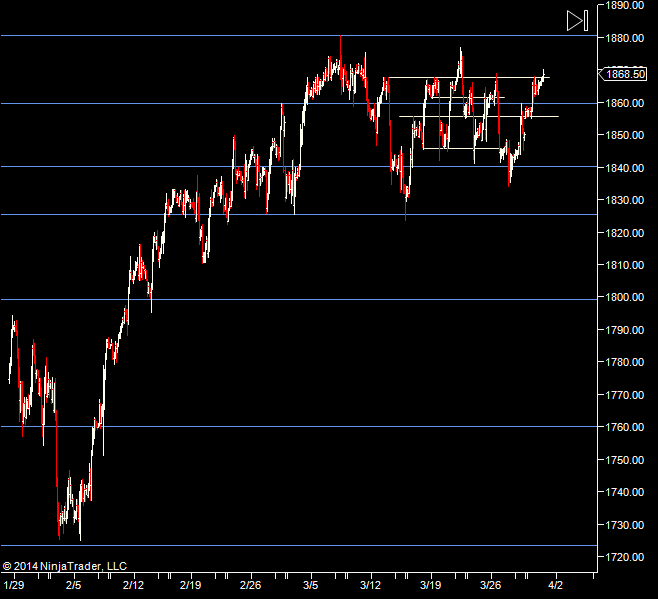
We are back to the middle of the range again, so a good potential for chop. The FOMC gave us a boost yesterday and we need to hang onto those gains for a run to 1890 and possibly beyond. We are just above the 59.50 level but that really hasn't helped us much in the past few months. The most significant levels have been the 39.50 and the all time high.
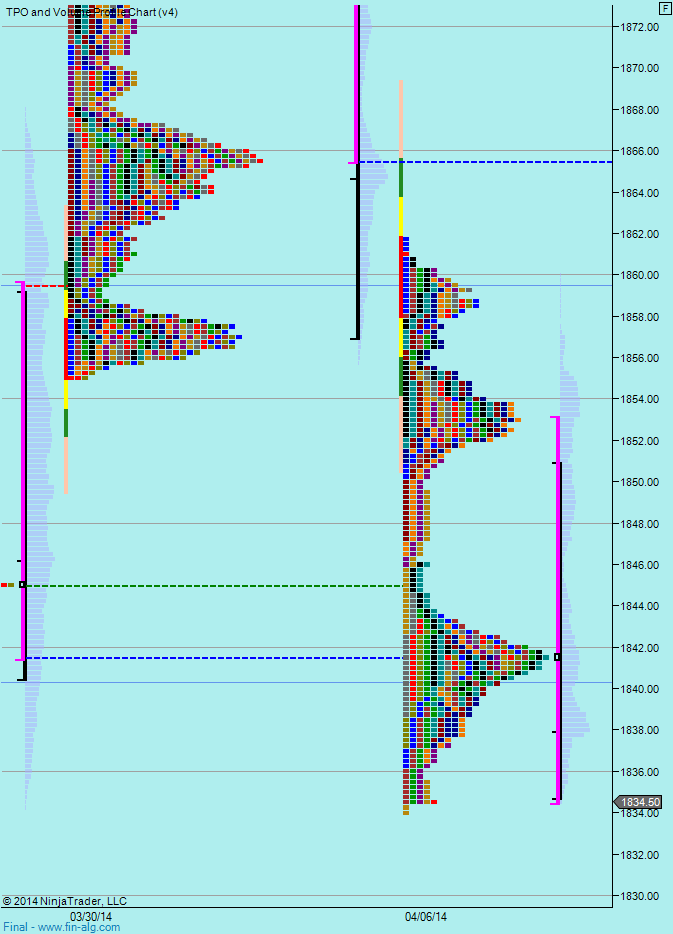
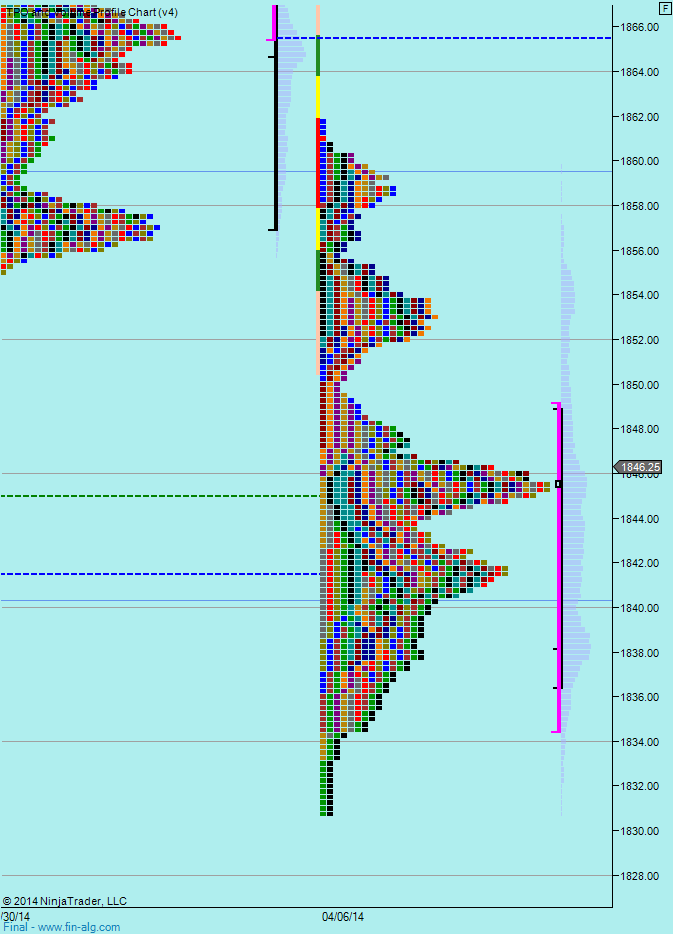
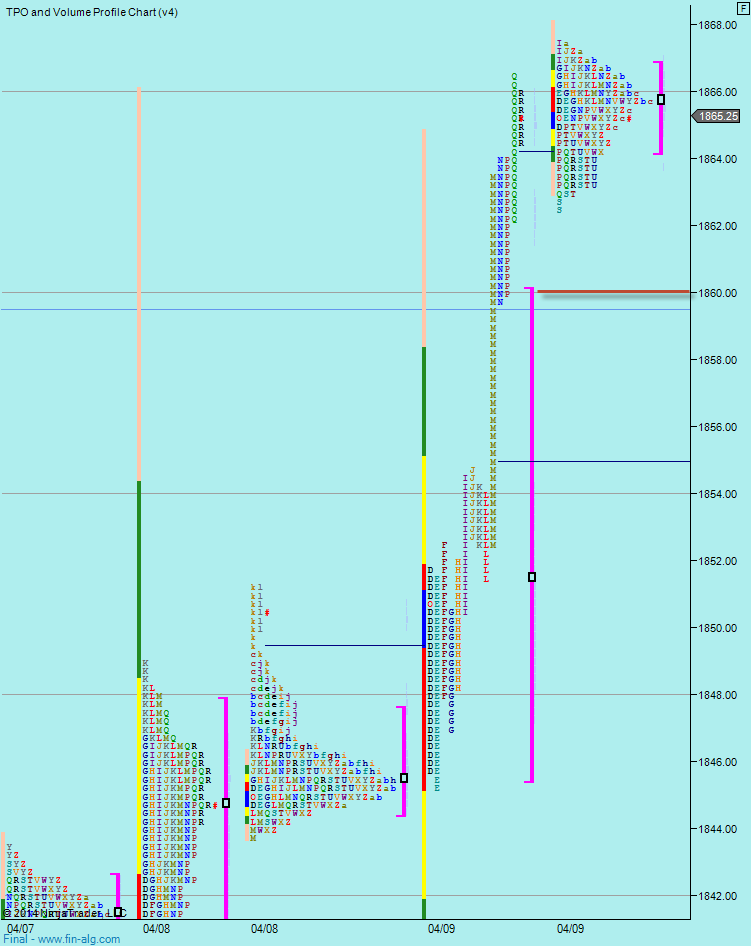
We popped up above the weekly value yesterday and the weekly value high is 1854, so that's a minor level for me in terms of being bullish.
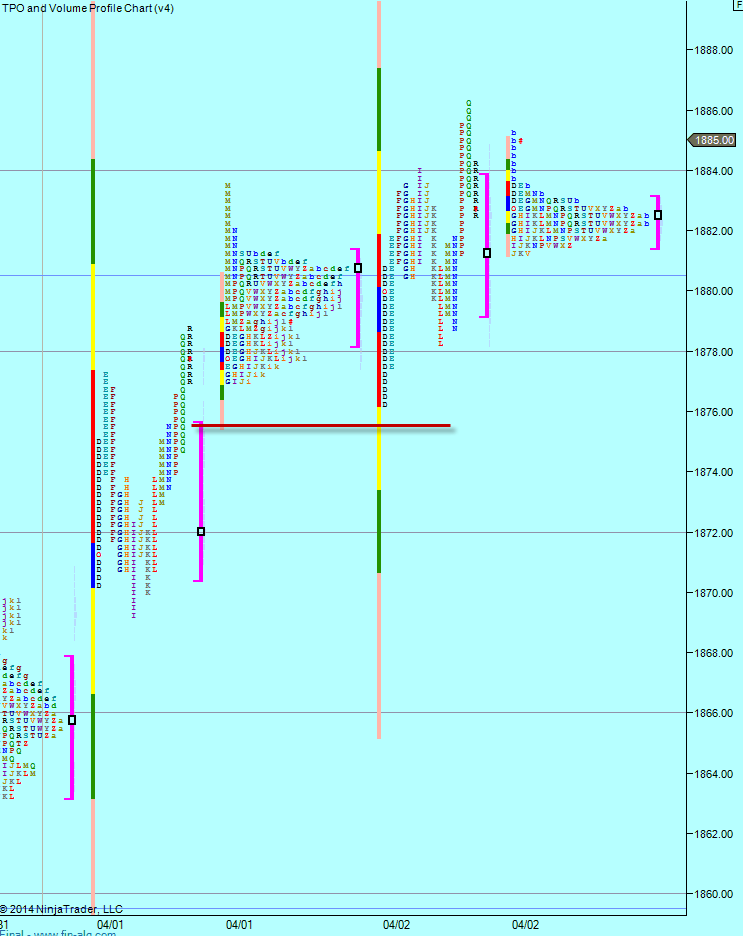
The split globex/pit profile is showing us a few interesting things. We have value high at 1860 for yesterday and a "single print" at 1855. The single is effectively the breakout point after the FOMC. Tests of these levels in the pit session should be the best indicator of whether we can carry on up or not.
Unemployment numbers at 8:30am might also help set the tone for the day.
So whilst we are in the chop zone, we do have a couple of levels that could potentially act as decent lines in the sand. Mostly it's 1854-1855 & 1860.
Weekly Numbers
Range - 1830.75 -> 1867.50
Value 1836.50 -> 1854.50
S1 - 1846.50, R1 - 1883
Daily Numbers
Range - 1843.75 (globex) / 1845.25 (pit) -> 1866.50
Value - 1845.50-> 1860
Globex - 1859 -> 1867.50 (globex spiked down after taking above screenshots)
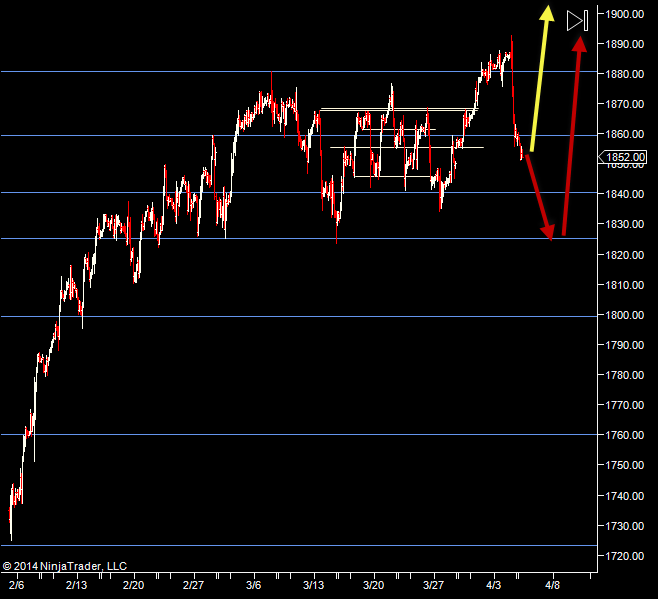
Well - the sky might NOT be falling - but I wouldn't fade the down moves....
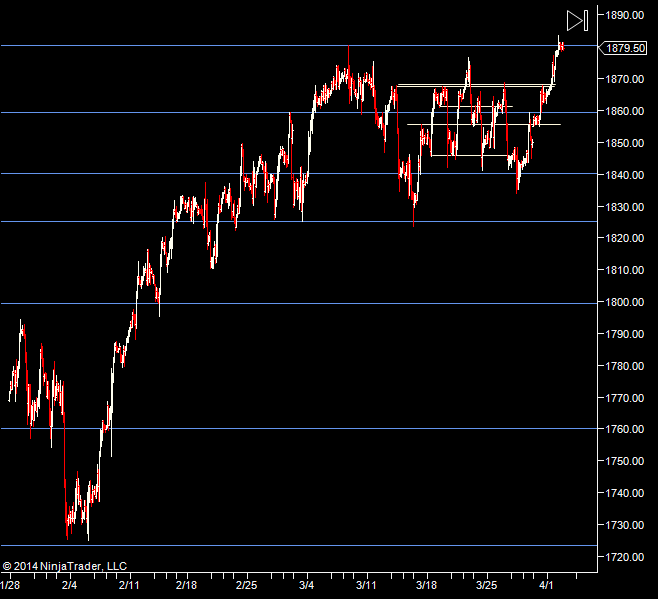
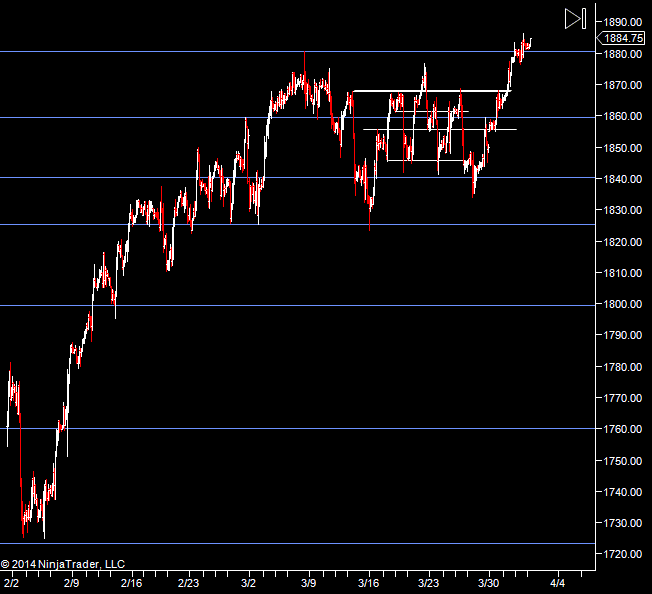
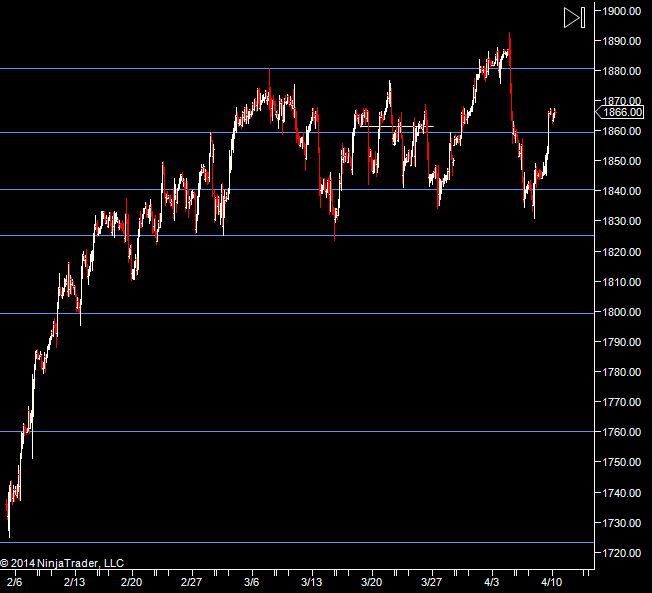
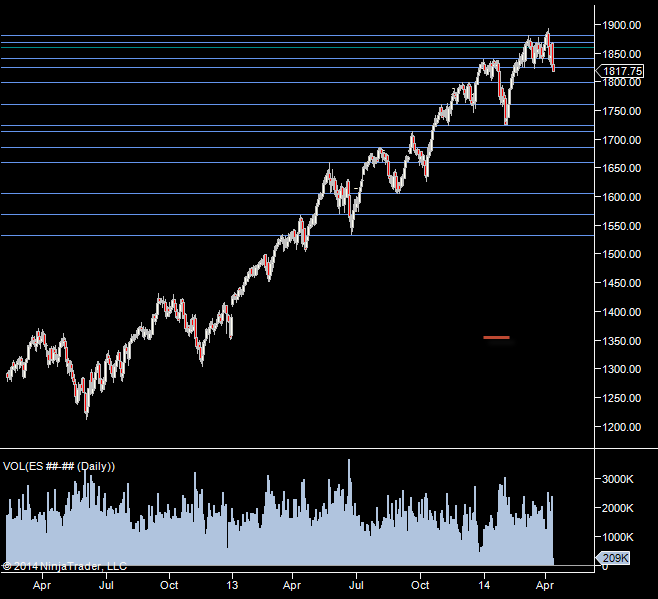
There is a lot of chatter around about this being the start of a major correction. That's fine for us but looing at this chart of the past 2 years, even a move as low as 1700 wouldn't really be much more than a move back to a major level and therefore still exhibiting longer term range bound behavior. Not that we care too much from a trading perspective.
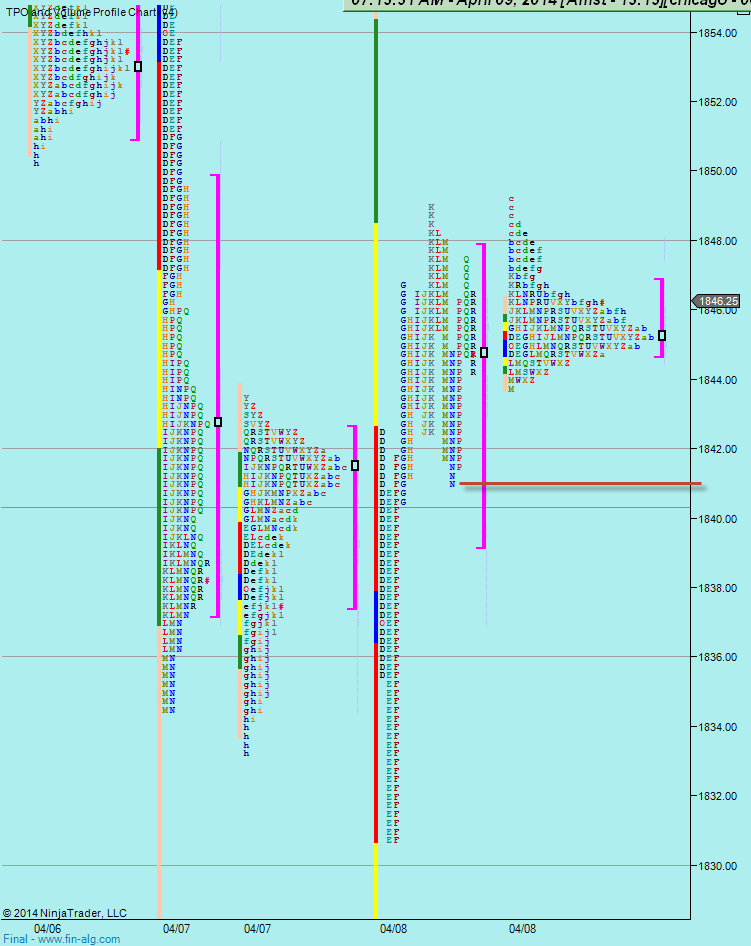
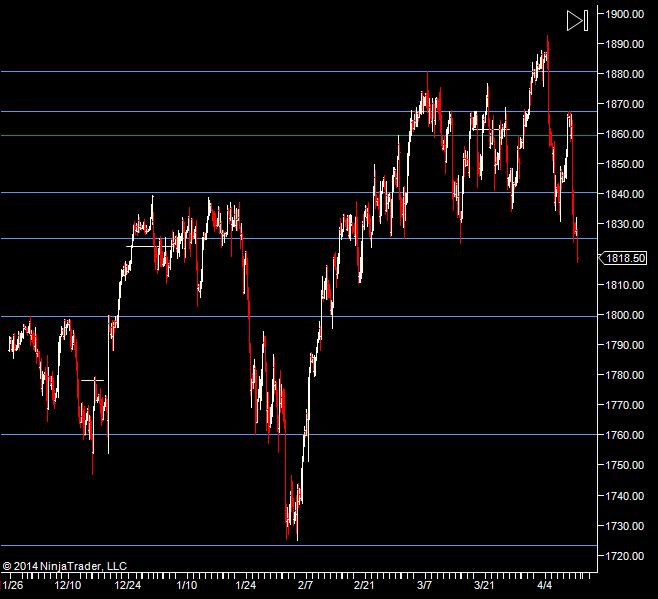
We can see that the 1825.25 level has broken and that needs to stay broken into the pit session ti see us go to the next level just below 1800. Shorts can get squeezed at any time but long is obviously the riskier trade right now. Looking above, we can see that even a dip to 1723.25 is merely going back to test February lows. So there's plenty of potential for more downside. Volume on the down days is clearly larger than on the up days and although yesterday started out choppy, the delta was moving down straight from the start.
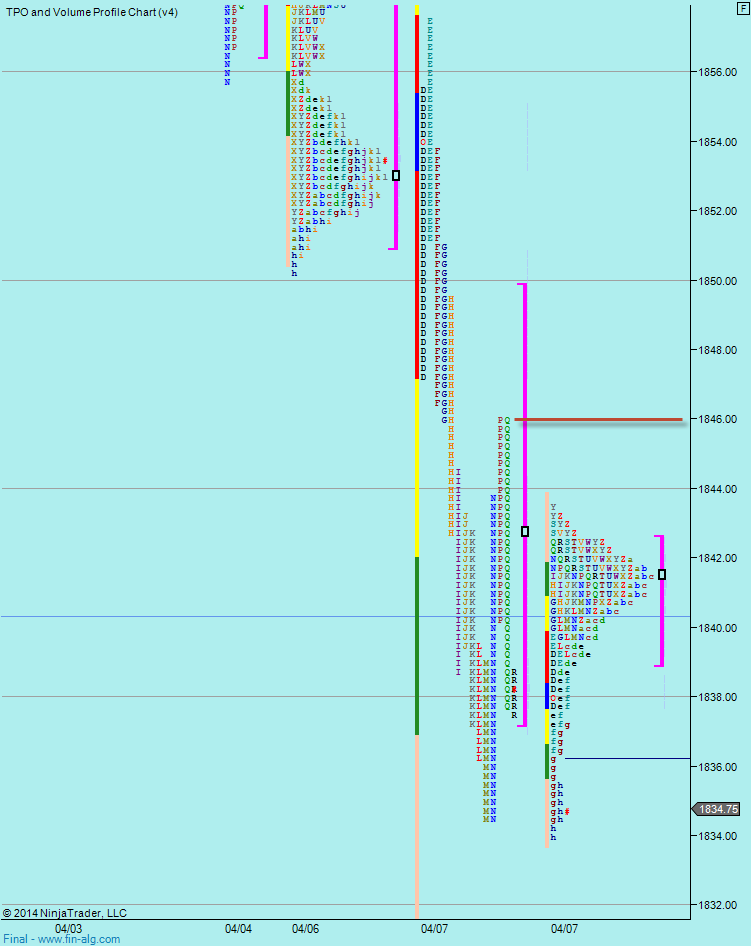
In terms of profiles, the weekly value low is 1834.50 for the week, so if we work above that it becomes slightly more bullish but it's not so much a game of price levels today as it is seeing the sellers bail in the delta. If they keep hitting as yesterday, then there's no point in getting long until they have clearly stopped and are clearly getting squeezed.
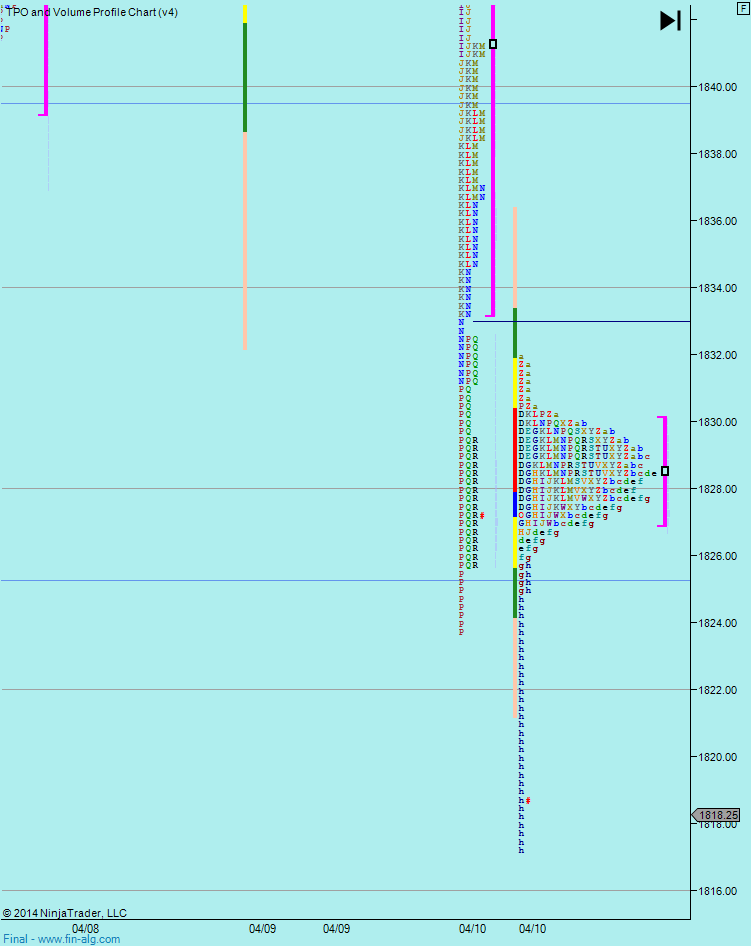
As we can see the Globex session is below yesterdays Value low and pushing down. Overnight inventory is long which often gives us a correction upside off the open. Yesterdays VAL is 1833.25, not far from the weekly, so that's a test for the longs.
Weekly Numbers Range - 18314.50 -> 1867.50
Value 1834.50 -> 1861
S1 - 1846.50, R1 - 1883
Daily Numbers
Range - 1823.75 -> 1866.50
Value - 1833.25-> 1863.25
Globex - 1814.50 -> 1832