Welcome to NexusFi: the best trading community on the planet, with over 150,000 members Sign Up Now for Free
Genuine reviews from real traders, not fake reviews from stealth vendors
Quality education from leading professional traders
We are a friendly, helpful, and positive community
We do not tolerate rude behavior, trolling, or vendors advertising in posts
We are here to help, just let us know what you need
You'll need to register in order to view the content of the threads and start contributing to our community. It's free for basic access, or support us by becoming an Elite Member -- see if you qualify for a discount below.
-- Big Mike, Site Administrator
(If you already have an account, login at the top of the page)
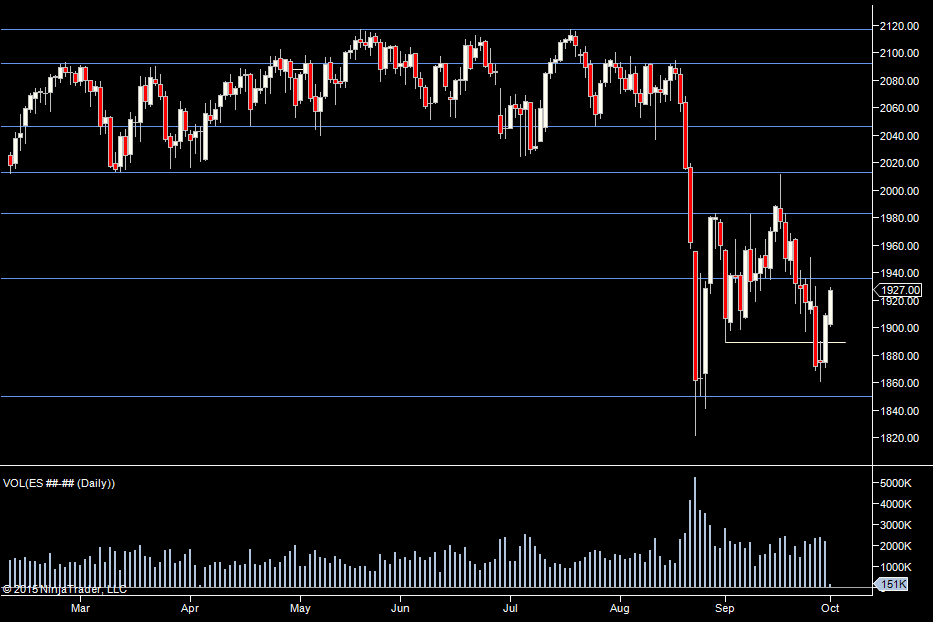
We are working our way through the September range. We do have a level at 36.25, but that hasn't been relevant in September, so I don't see it being relevant today.
Volume has been the same on the way down and the way up, it's quite a schizophrenic market right now.
Looking at where we've traded in the past month, we've had the most volume at 1934, so again an eye on that level for a reversal but once through it, we should be headed to 1983. That would be normal rangebound behavior. Failure at the POC should see us testing the range lows.
We have an extended move up overnight with very little traded, so from where we are now, I'd be very cautious with any long trades if we go below 1920 as there's so little volume there we could drop down to 1907 very quickly.
With a long bias, a retest of yesterdays high or value high would be interesting trades.
Weekly Numbers
Range 1861-> 1929.75
Value 1866 -> 1905
S1 - 1888, R1 - 1959.75
Daily Numbers
Range -1871.25 / 1886.50 (day) -> 1910.50
Value - 1894.50 -> 1905
Globex - 1901.25 -> 1929.50
Settlement - 1908.75
Today Only 1934
Long Term 2117, 2092.50, 2046.75, 2013, 1983, 1936.25, 1850, 1781.50
If you have any questions about the products or services provided, please send me a Private Message or use the futures.io " Ask Me Anything" thread
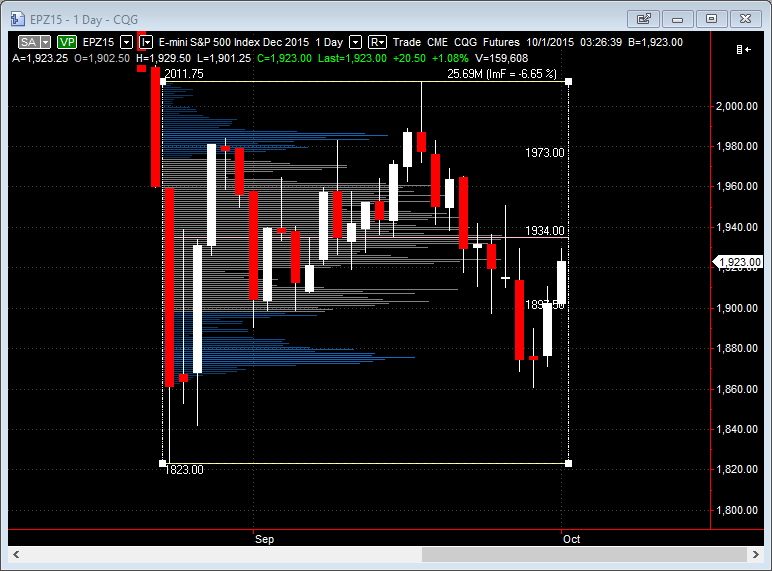
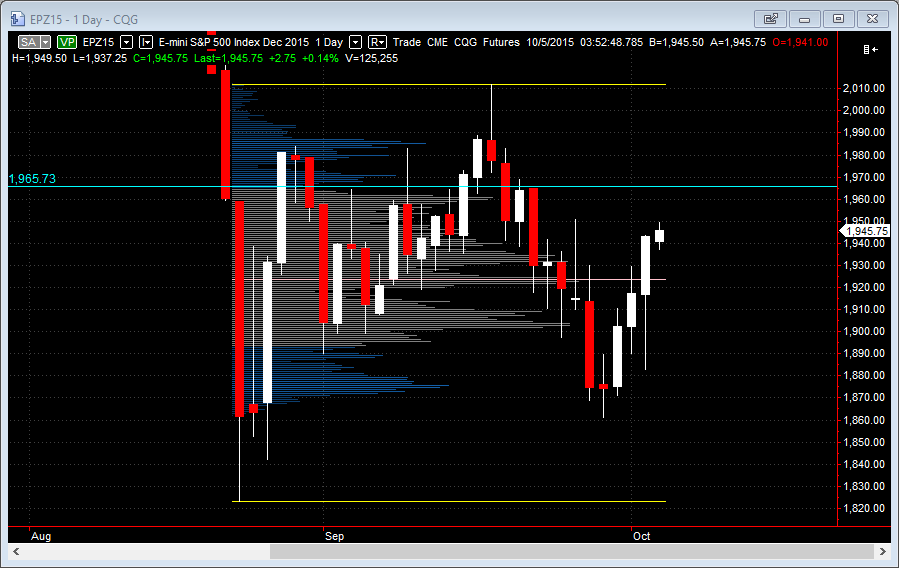
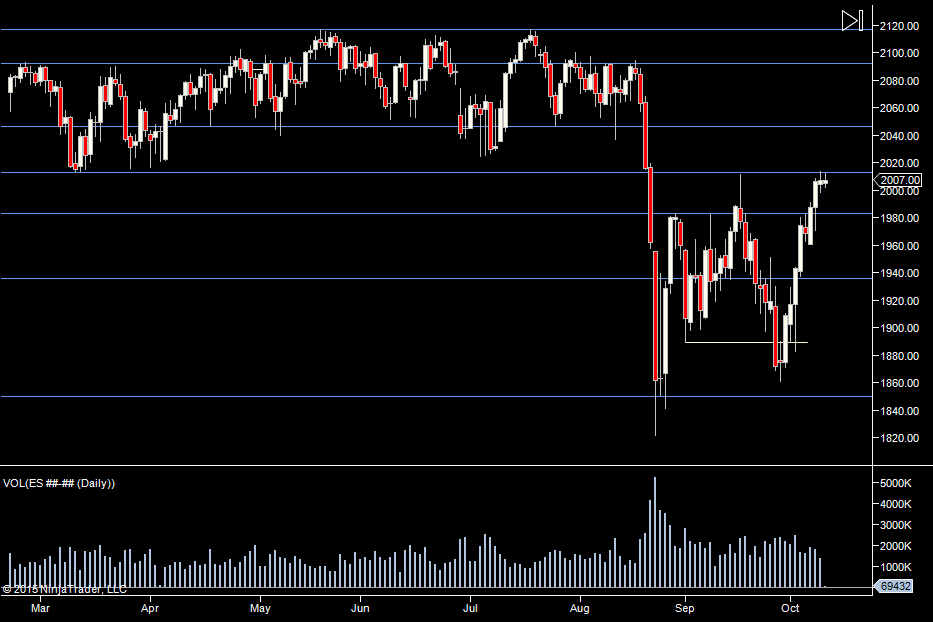
We are on our way up to the top of the range, which could well be the level above 1983 or the level we spiked up to on the FOMC - 2013. Either could be the top of the range.
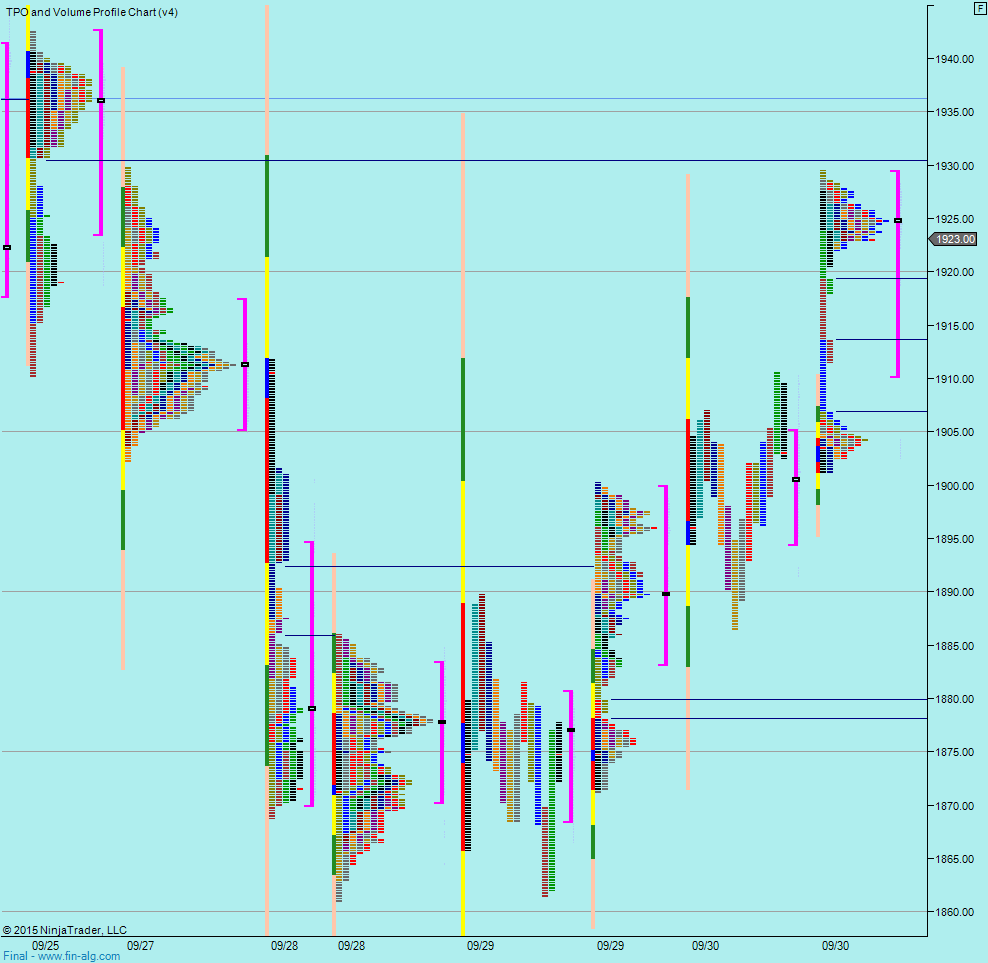
The weekly profiles are fairly useless right now as we keep going over the same ground. Looking at the volume profile since we have been in this range, we can see that we have moved through the POC, which also indicates a good chance of a trip to the top of the range.
Above us at 1965.75 - just above value for this range, we have a low volume node, so we need to pay attention when we get to that point as a potential point of failure.
With a long bias, I like to look for areas of potential support below. Thursdays high of 1929.50 is a good candidate as is the single print at 1926.75.
So a long bias but as usual with the caveat that we just had a day that moved from top to bottom 60 points, and we are in a choppy area.
Weekly Numbers
Range 1861-> 1943.75
Value 1882.50 -> 1926.50
Daily Numbers
Range -1883 -> 1943.75
Value - 1900.50 -> 1943.50
Globex - 1937.25 -> 1950
Settlement - 1943
Today Only 1965.75, 1926.75->1929.50
Long Term 2117, 2092.50, 2046.75, 2013, 1983, 1936.25, 1850, 1781.50
If you have any questions about the products or services provided, please send me a Private Message or use the futures.io " Ask Me Anything" thread
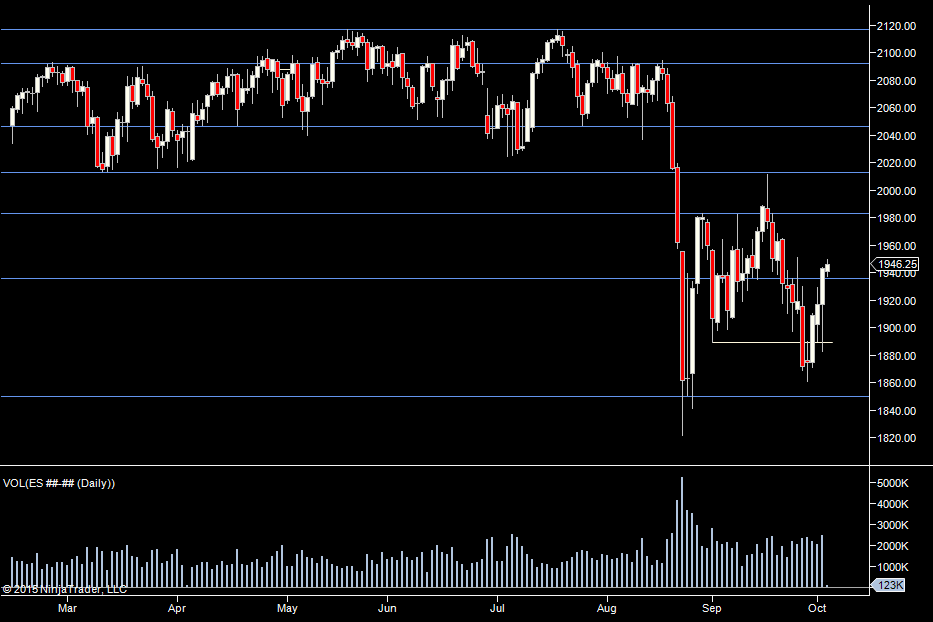
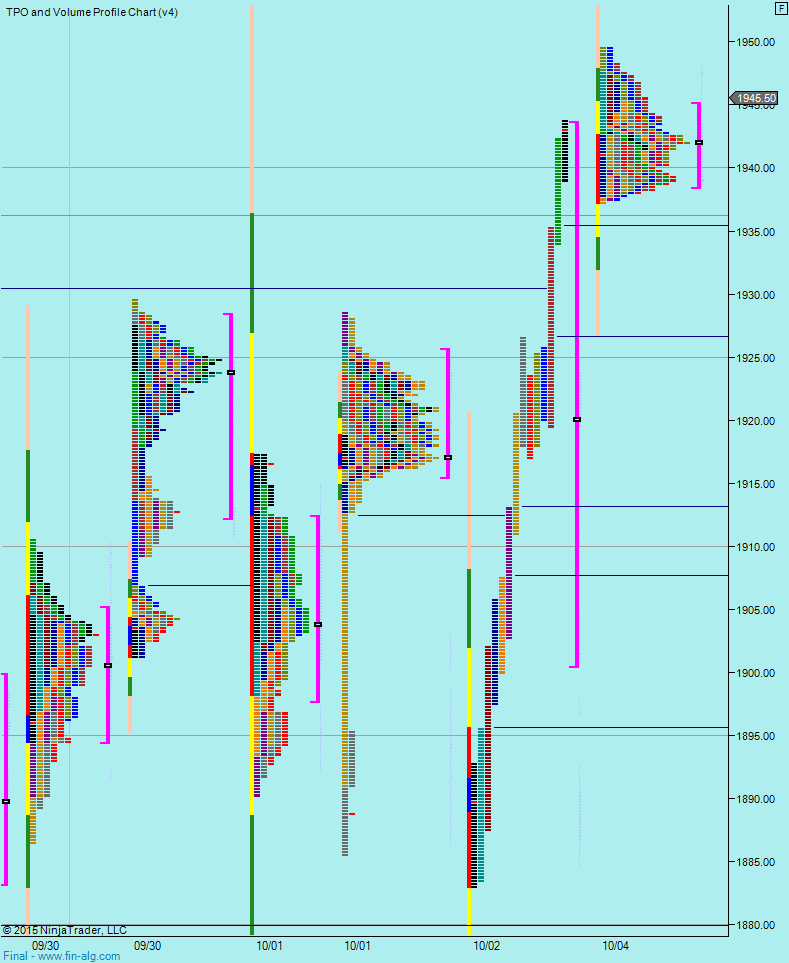
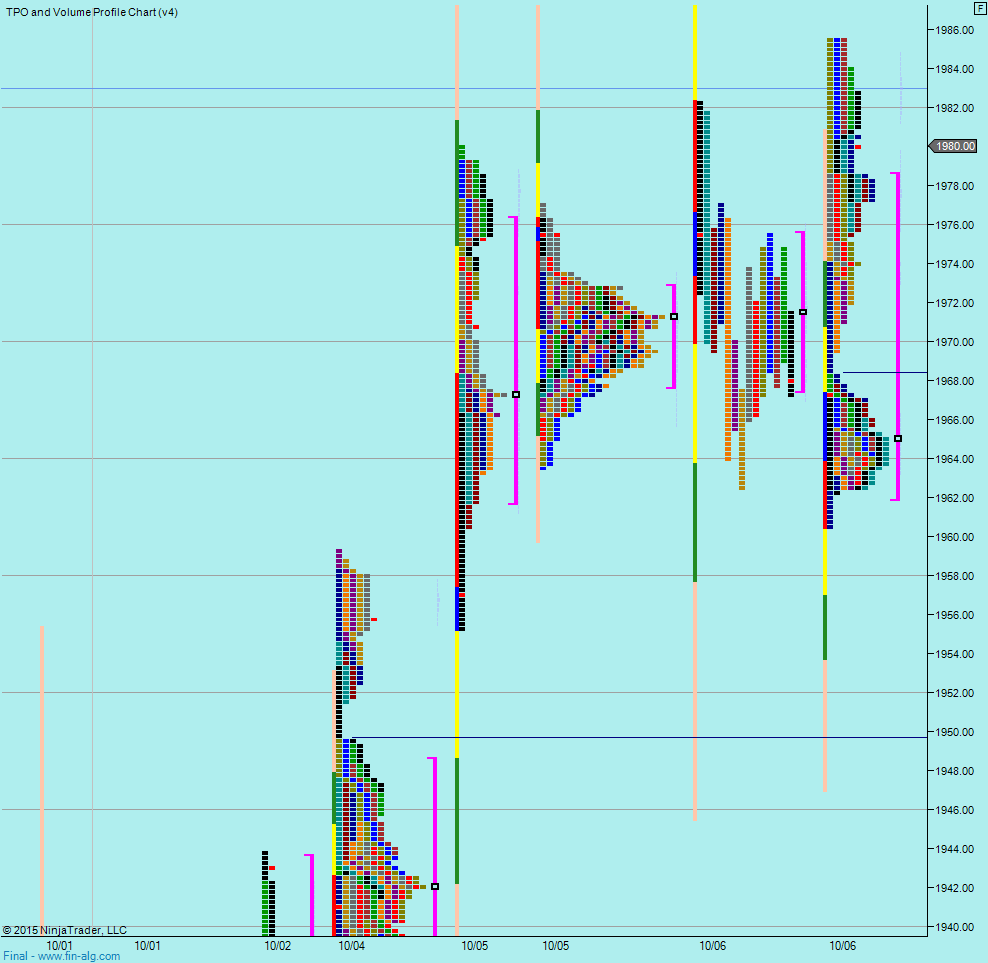
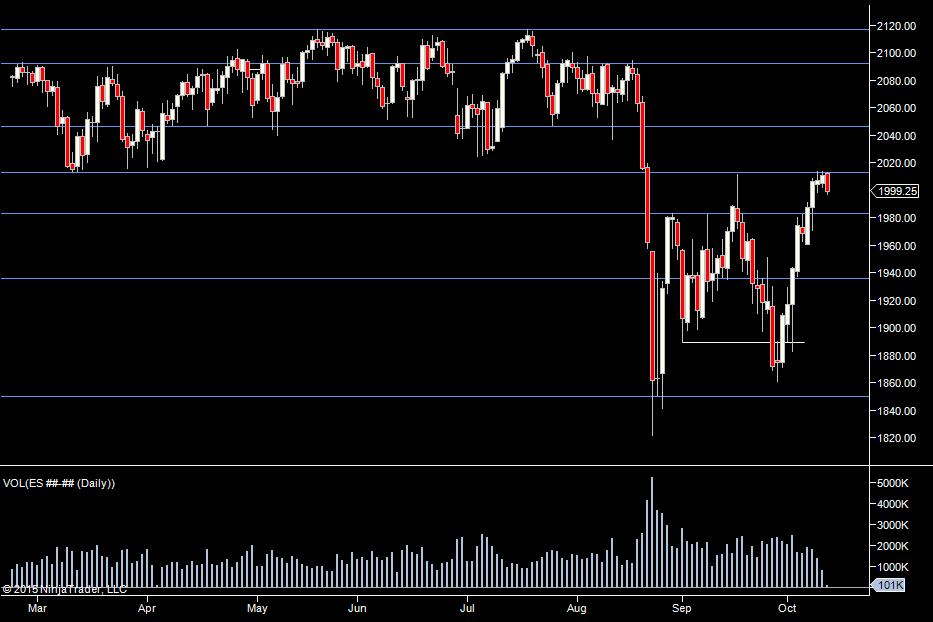
We moved up just shy of our 1983 level. As before, this was the high of our range but there is a case for 2013 being the high of the range. That was a spike up on the FOMC news, so it's possibly just an anomaly. I think we have to keep an open mind about which is the high.
So the upshot is - we may now be done to the upside. We could now have failed to reach the range high and be starting a move down. There is also case for a move through 1983 to signal an end to the range and for us to be heading up. So basically, we are at an inflection point and so rather than flipping a coin, I plan to let it play out and then join any resulting momentum.
From a volume profile perspective - looking at the volume for the entire range, we are also above value, so again that indicates that we need to be on the lookout for the market rolling over.
To the downside, I have an eye on yesterdays value low/low as well as the 60.50 level as that's where we found support yesterday before making our way up.
Obviously, also an eye on the upside levels for a failure or any push down off the news as we may already be done to the upside.
Weekly Numbers
Range 1861-> 1943.75
Value 1882.50 -> 1926.50
Daily Numbers
Range -1937.25 / 1955.25 (day) -> 1980
Value - 1961.75-> 1976.25
Globex - 1963.50 -> 1976.25
Settlement - 1974.75
Long Term 2117, 2092.50, 2046.75, 2013, 1983, 1936.25, 1850, 1781.50
If you have any questions about the products or services provided, please send me a Private Message or use the futures.io " Ask Me Anything" thread
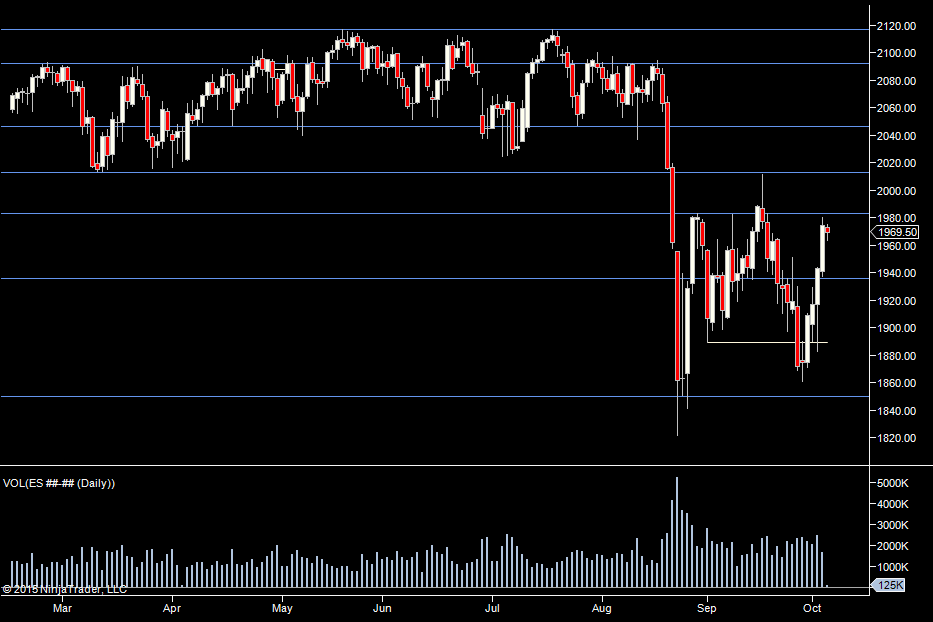
We are still around the 2083 inflection point, we are holding for now but volume is tapering off and I think one scenario is that we sit here for the next couple of days.
Looking at the volume profile for the range, not much has changed, value has moved slightly higher but we are still at the top of value.
If we do trade here for a few days, that will build stops either side of the few days range and that could give us the momentum we need to finally break the range if we move upside. We don't have much news today, so I'm not expecting too much.
We've been above and below yesterdays range overnight. We poked through the 83 level and are new below it. Early on I'm watching yesterdays value area for a potential hold but I think this is all about the range today and I think probability is to the downside, although 'top of the range' is still to be confirmed as we've not tested the top since the 2013 FOMC spike.
Weekly Numbers
Range 1937.25-> 1985.50
Value 1962.25 -> 1981.75
Daily Numbers
Range -1962.50 -> 1982.25
Value - 1967.50-> 1975.50
Globex - 1960.50 -> 1985.50
Settlement - 1968.50
Long Term 2117, 2092.50, 2046.75, 2013, 1983, 1936.25, 1850, 1781.50
October 5th, 2015 04:53 PM
If you have any questions about the products or services provided, please send me a Private Message or use the futures.io " Ask Me Anything" thread
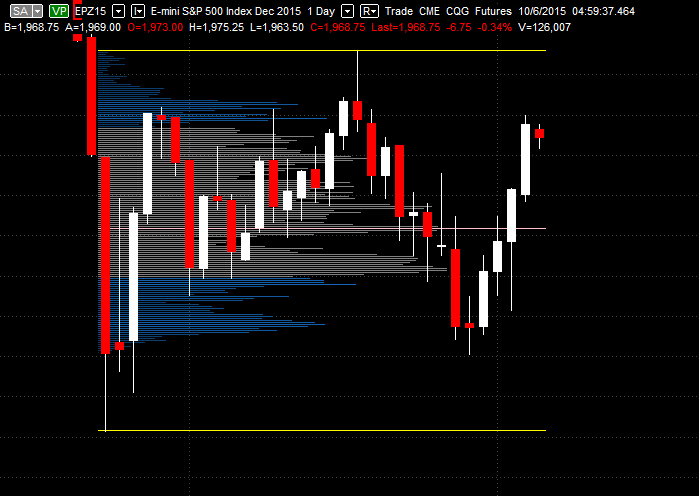
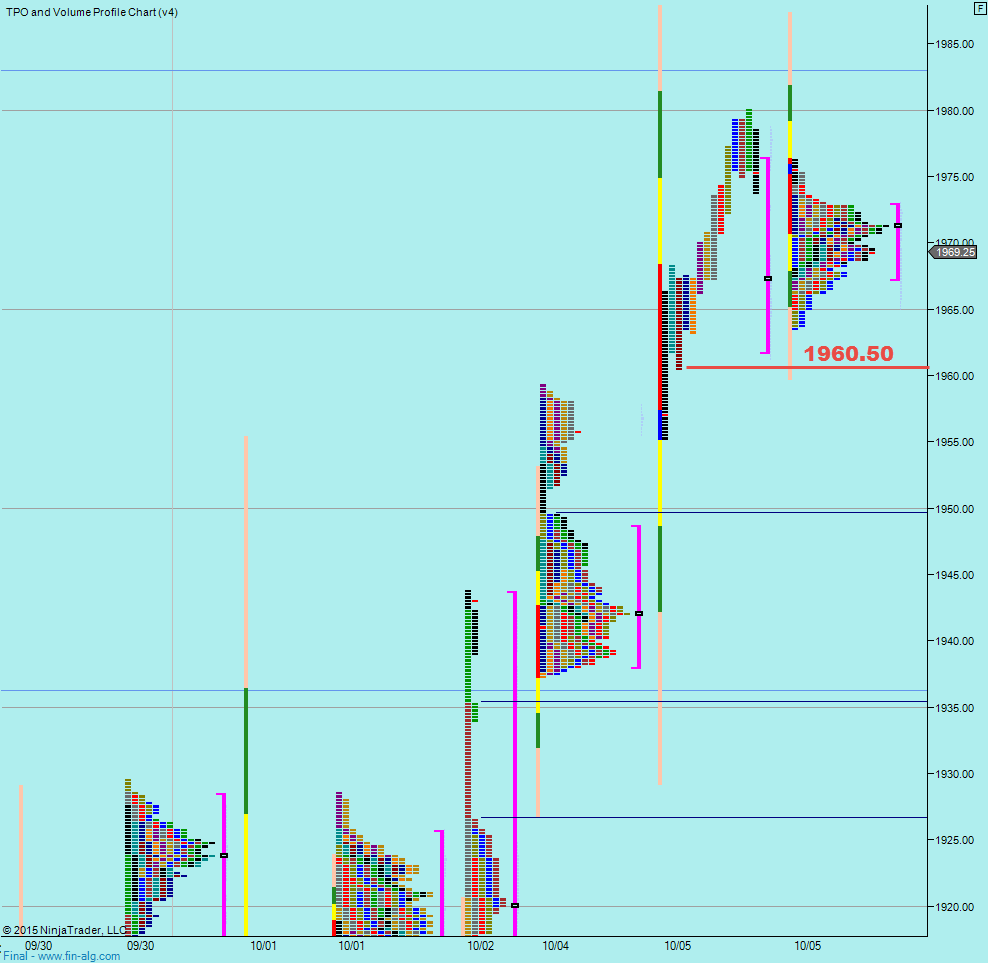
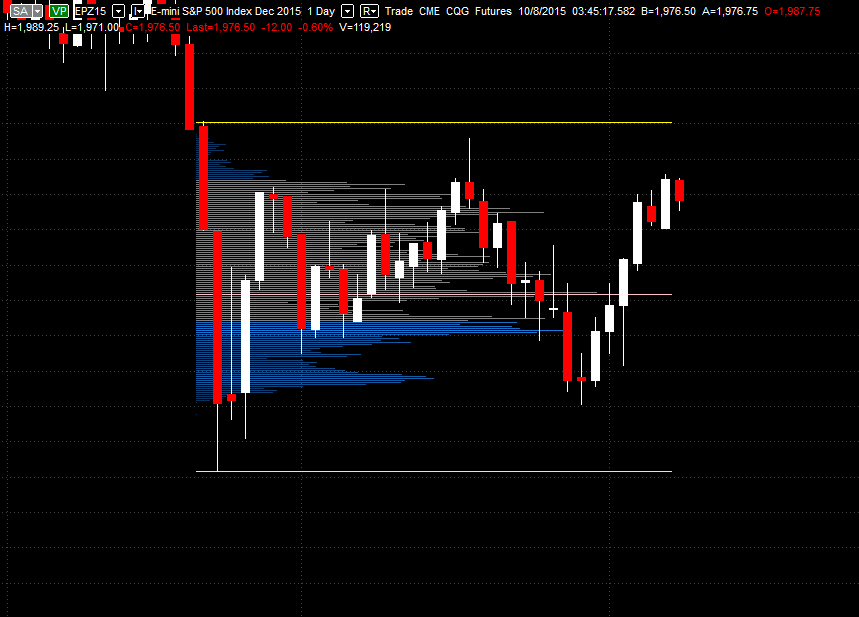
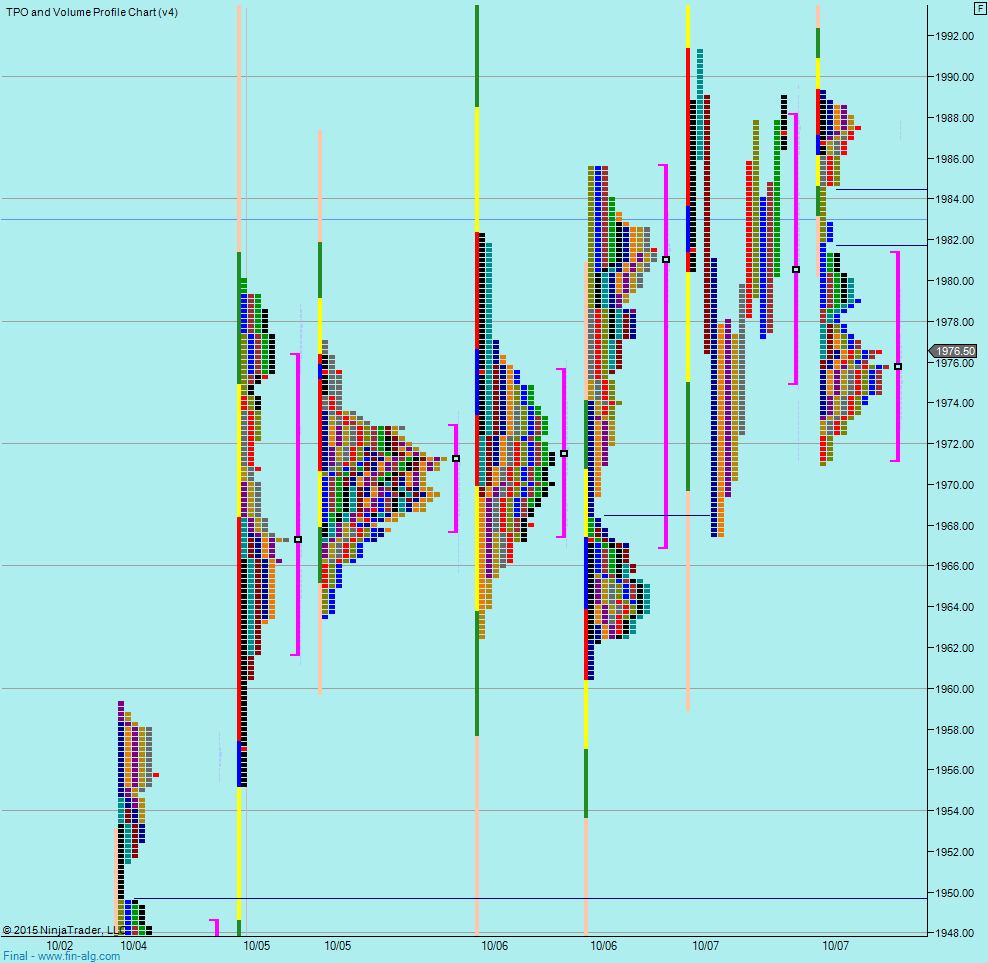
So pretty much the same story today.... although now 3 days in a relatively tight range at the top of value, we have stops above 1991 and below 1960.50, so that may give us the push we need to break the range.
Or we could just hang here another day.
We do have unemployment numbers at 8:30, so that could give us a push.
No real change in terms of value around the range.
Today, I'll be looking to fade the extremes but expecting a headfake first if we do move upwards. Judging by the overnight action, we may be set to test the 1960.50 area first.
I'll keep an eye on volume as that'll be the best indicator of whether we wan to challenge this range or not and whether fading is the best plan.
Weekly Numbers
Range 1937.25-> 1991.25
Value 1963.25 -> 1982.75
Daily Numbers
Range -1960.50 / 1967.50 (day) -> 1991.25
Value - 1975 -> 1988
Globex - 1971-> 1989
Settlement - 1987.25
Today only - 1991, 1960.50
Long Term 2117, 2092.50, 2046.75, 2013, 1983, 1936.25, 1850, 1781.50
If you have any questions about the products or services provided, please send me a Private Message or use the futures.io " Ask Me Anything" thread
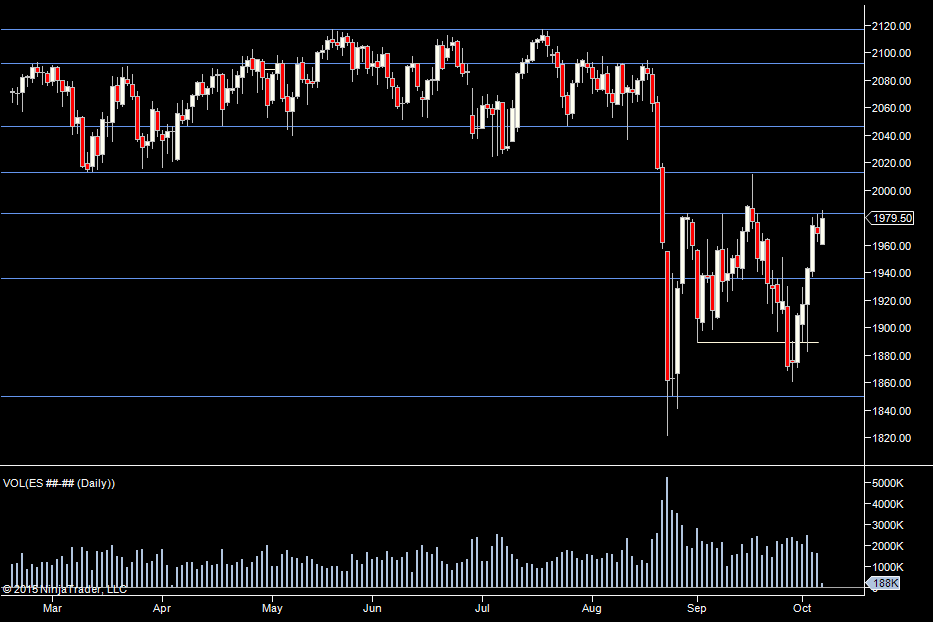
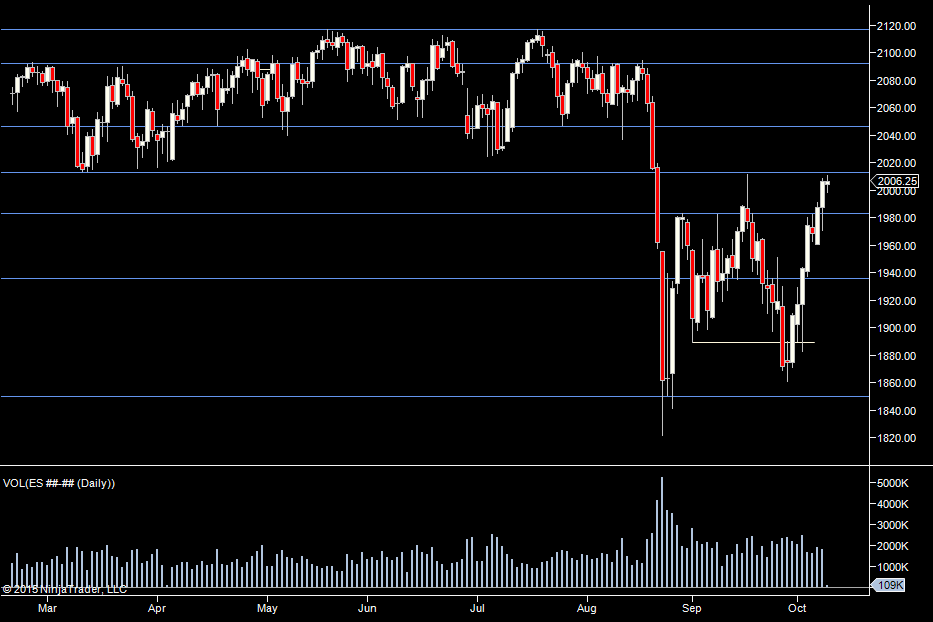
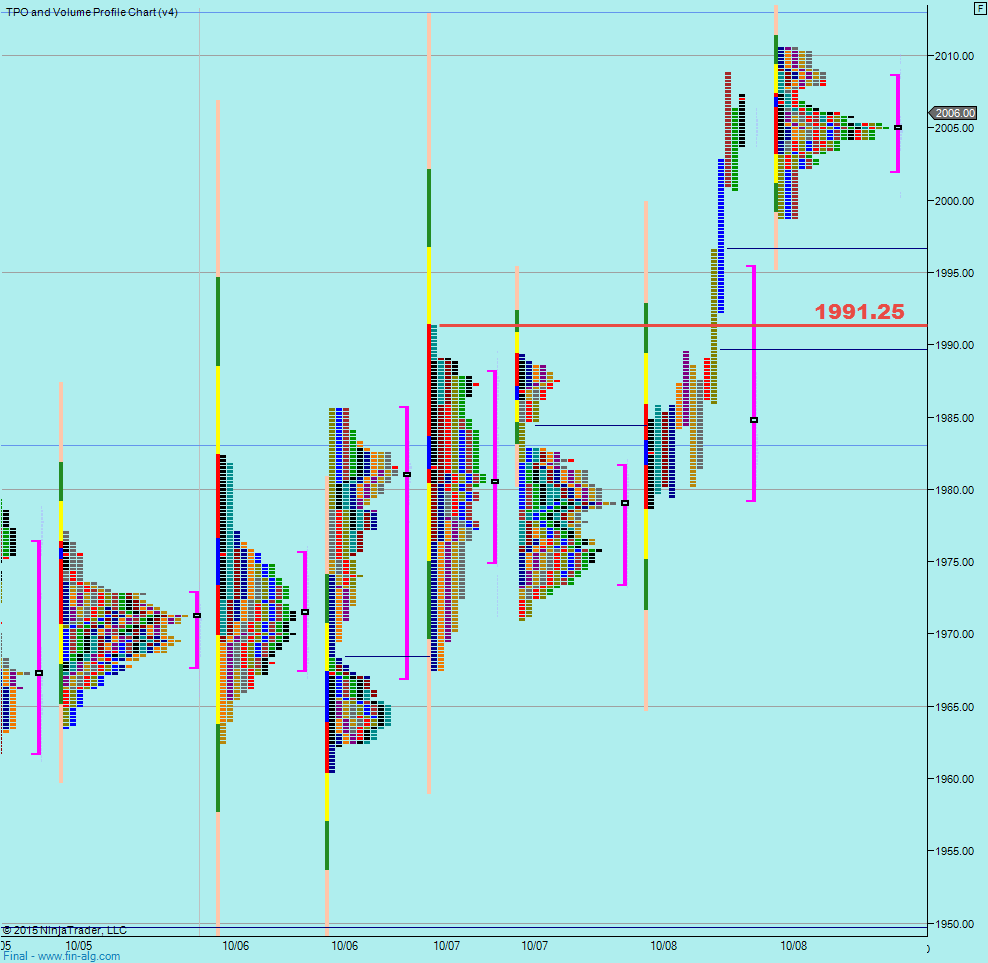
Looking left - the last time we hit this level was.... the last FOMC. So another FOMC and another spike up - this time falling just shy of last months spike.
Today is fairly simple - do we carry on or will we roll over & what points can we play off?
We broke out from the 1991.25 level, any move up from yesterdays value high or 1991.25, I see as a decent chance to break the 2013 level and see us then start making moves to the all time highs.
Given the tone of FOMC - it's hard to see where the bullishness will come from.
So my 'bar room guess' is that we roll over and head back to 1820.
From a trade perspective, today I'm going to stand aside the first 15 minutes and then try to join any momentum moves. Without a pullback to a reference point, I'd rather go long above 2013.
To the downside, I don't really have any resistance level I'd like to see tested first, I think if there is a sell off it'll be fairly clear plus many people will be looking at this as having failed to get to the old FOMC high anyway and that may be enough to kick off the selling.
Weekly Numbers Range 1937.25-> 2010.50
Value 1963.25 -> 1987.75
Daily Numbers
Range -1971 / 1978.75 (day) -> 2008.75
Value - 1975 -> 1995.25
Globex - 1998.75 -> 2010.50
Settlement - 1987.25
Today only - 1991, 1960.50
Long Term 2117, 2092.50, 2046.75, 2013, 1983, 1936.25, 1850, 1781.50
If you have any questions about the products or services provided, please send me a Private Message or use the futures.io " Ask Me Anything" thread
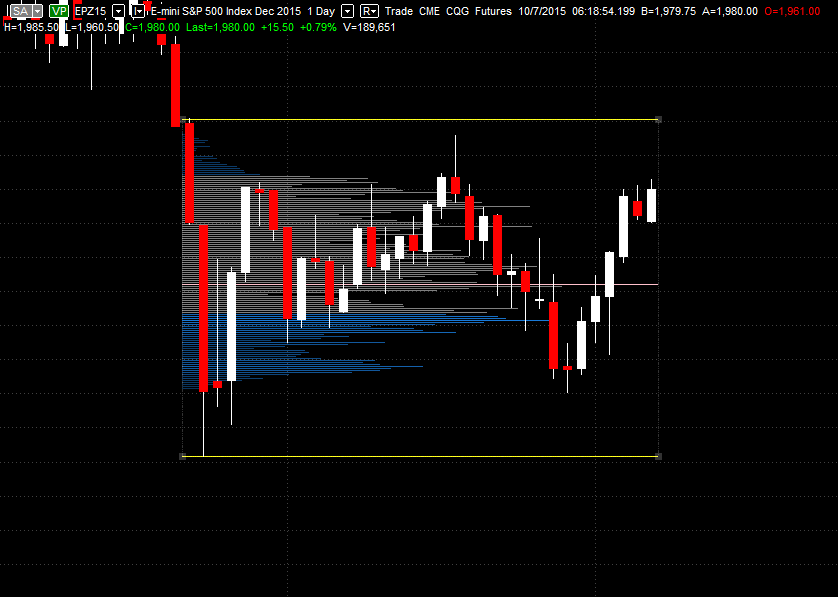
Still up around this 2013 level, waiting to see if we can break one way or the other. No clear indication either way yet of which way we'll go, although I favor the downside.
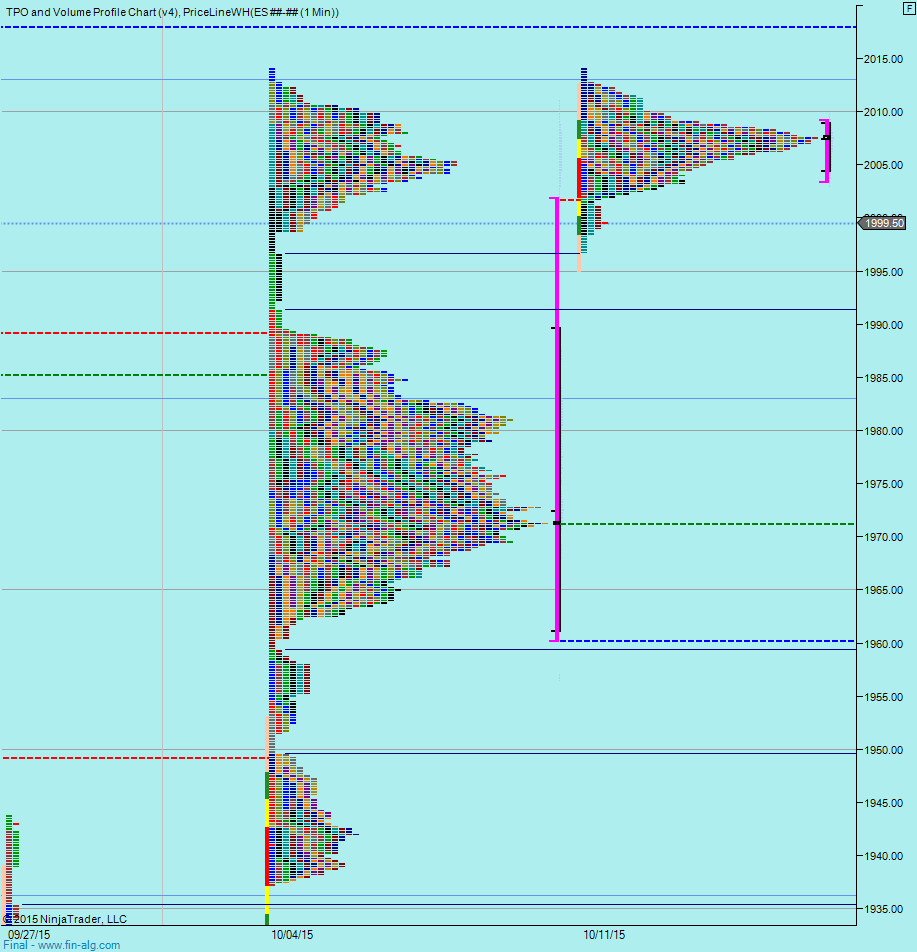
We can see that last week most of the trading was between 62.50 and 1989, so as long as we stay above 89, the prospecr of a break upside is still likely. Below 89 and I think we'll most likely start moving to the range lows.
We have a nice little range building at the top, 1998.75-2014, we've probed down through it overnight to the single print at 96.75. Hopefully this tight range will have some stops around it that will help the break.
What we don't have today is any significant news to give us the nudge out, so we could get caught here for a couple of days.
Weekly Numbers
Range 1937.25-> 2014
Value 1960.25 -> 2001.75
S1 - 1888, R1 - 1970.75
My apologies for lack of prep last week. Sometimes you run the business. Sometimes the business runs you.
My market profile charts are temporarily out of order too.
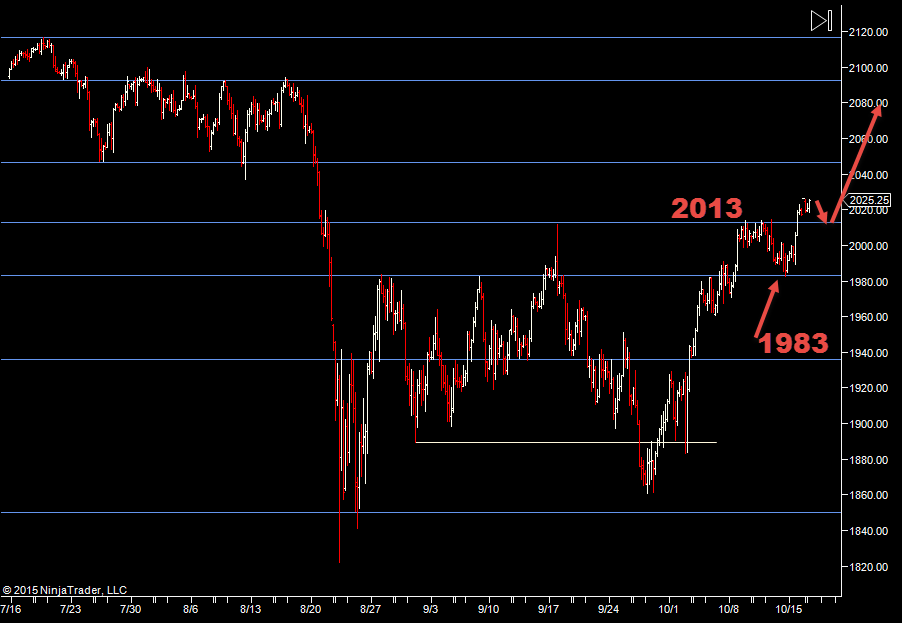
Anyway, after the "FOMC pop" we took a trip back to 1983 and that held, so I think we have a very good chance of leaving this range now. I'd like to see us come back and test 2013 because I think that'll bring in more participation.
So today - looking for longs, hopefully off a pullback. Off 2013 or off one of Fridays numbers. If we fail and roll back down, then it'll most likely be more chop - but I still expect it to be volatile and for us to have nice daily ranges. Only downside up here is Fridays really small range. We had a big move up overnight but the US session was very small.
So it's a "Go USA" day today - we want to see US traders showing a bit of enthusiasm to the upside.
Weekly Numbers
Range 1982.50 -> 2026.50
Value 1990 -> 2007.50
S1 1996.75, R1 - 2040.25
Daily Numbers
Range 1989.50 /2017 (day) -> 2023
Value 2017.75 -> 2020.75
Globex 2018.25 -> 2028
Settlement - 2025.50
Long Term 2117, 2092.50, 2046.75, 2013, 1983, 1936.25, 1850, 1781.50
If you have any questions about the products or services provided, please send me a Private Message or use the futures.io " Ask Me Anything" thread
Well - yesterday we were looking for a retest of the 2013 area. We fell 5 ticks short which should be good enough but the reaction upwards, whilst giving us a new daily high, was pretty lacklustre (excuse my English spelling).
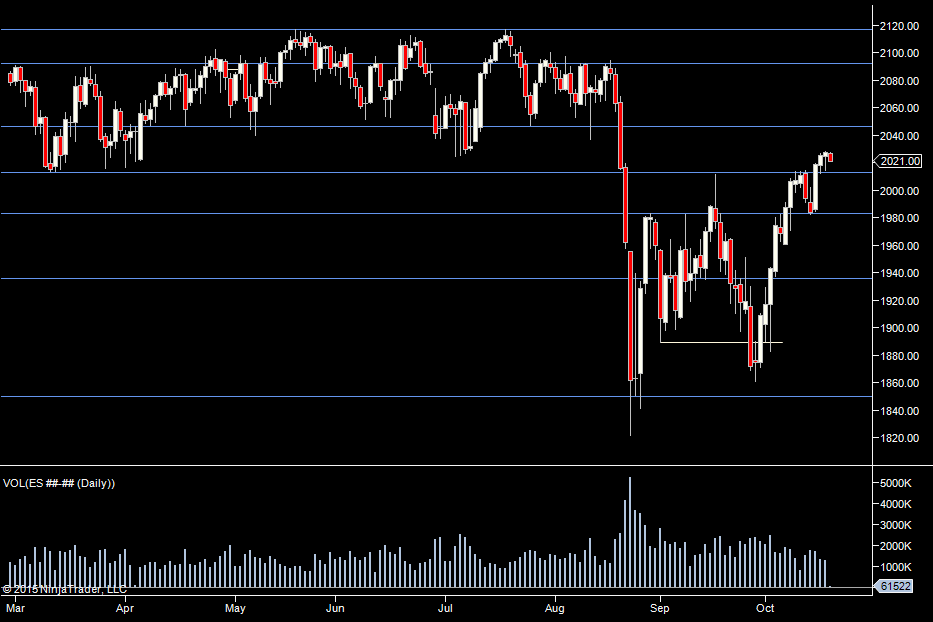
So we have a range break - but not much interest afterwards. Volume just 1.2 million yesterday. Right now, it seems there's not much interest outside of the range.
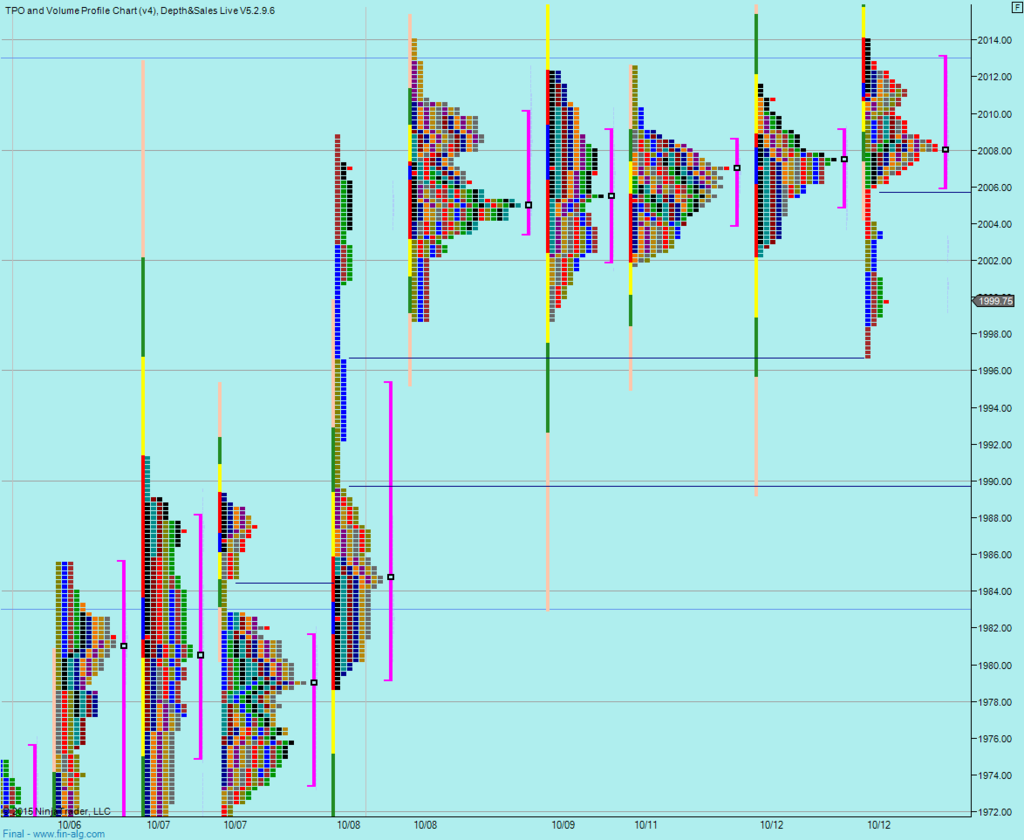
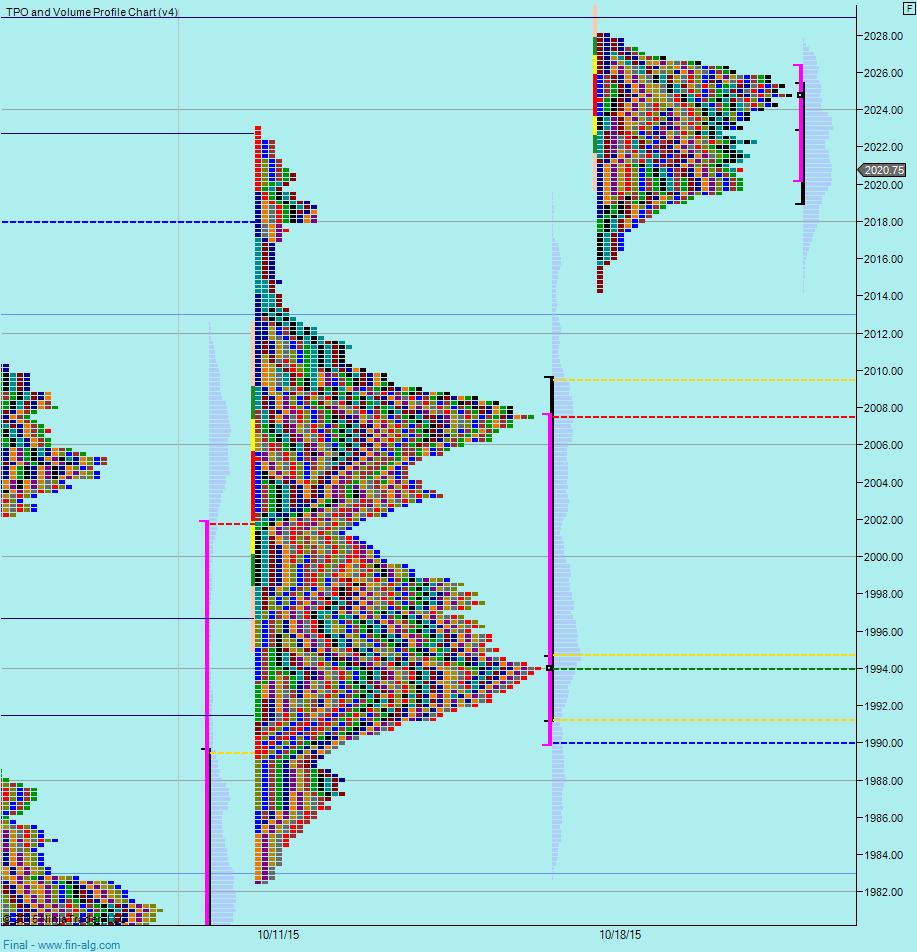
From a profile perspective, most of last weeks trading was below 2010, so we want to stay above that or I'll expect us to start working back down to 1990.
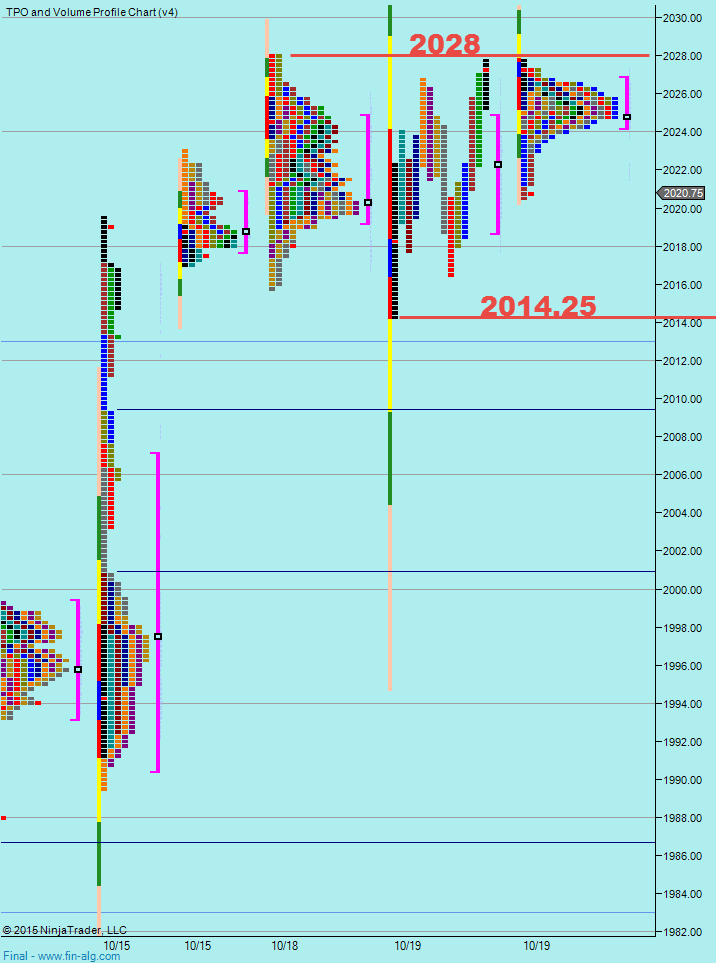
This is how range weeks start. Going today I'm watching the range extremes and how people react when we push through - if it gathers interest or if it's just a weak headfake. I still have an eye on 2013 for support but I'm trying to assess if this is just going to chop about. By 10am yesterday we were 200k contracts below average and it felt like it.
So I think today is all about the mode of the market. Trying to gauge if it's slow and fading ranges if it is. I can't for the life of me think what would bring volume in today if yesterdays hold at 14.25 didn't. Perhaps a deeper push down will give us a better reaction.
I guess I'm not expecting big things.
Weekly Numbers
Range 1982.50 -> 2026.50
Value 1990 -> 2007.50
S1 1996.75, R1 - 2040.25
Daily Numbers
Range 2014.25 -> 2027.75 (day) / 2028 (overnight)
Value 2018.75 -> 2024.75
Globex 2019.25 -> 2027.75
Settlement - 2027.50
Today only - 2010
Long Term 2117, 2092.50, 2046.75, 2013, 1983, 1936.25, 1850, 1781.50
If you have any questions about the products or services provided, please send me a Private Message or use the futures.io " Ask Me Anything" thread