Welcome to NexusFi: the best trading community on the planet, with over 150,000 members Sign Up Now for Free
Genuine reviews from real traders, not fake reviews from stealth vendors
Quality education from leading professional traders
We are a friendly, helpful, and positive community
We do not tolerate rude behavior, trolling, or vendors advertising in posts
We are here to help, just let us know what you need
You'll need to register in order to view the content of the threads and start contributing to our community. It's free for basic access, or support us by becoming an Elite Member -- see if you qualify for a discount below.
-- Big Mike, Site Administrator
(If you already have an account, login at the top of the page)
After 21 and a bit hours on airplanes, I'm back from Chicago and home on the range in Bangkok.
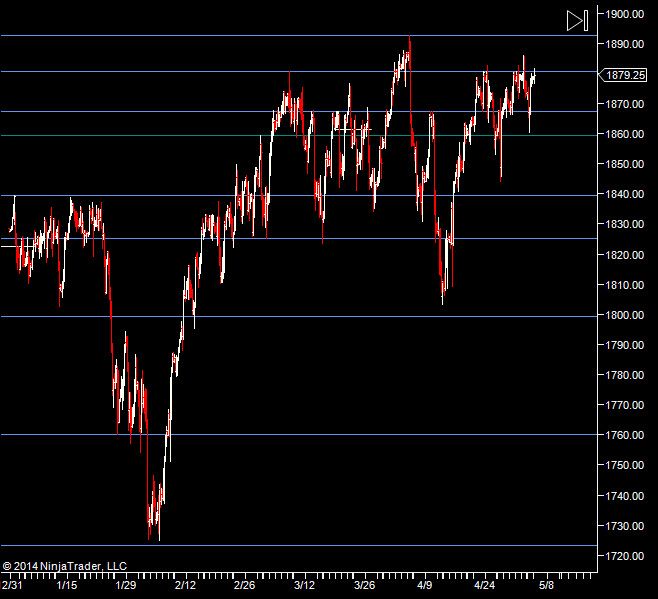
Once again we have all the appearances of a potential "run to the highs". Still - I've been thinking that has been on the cards for a while. So once again I'll be looking for a downside reference to play a long off but will be ready to go short if those references fail.
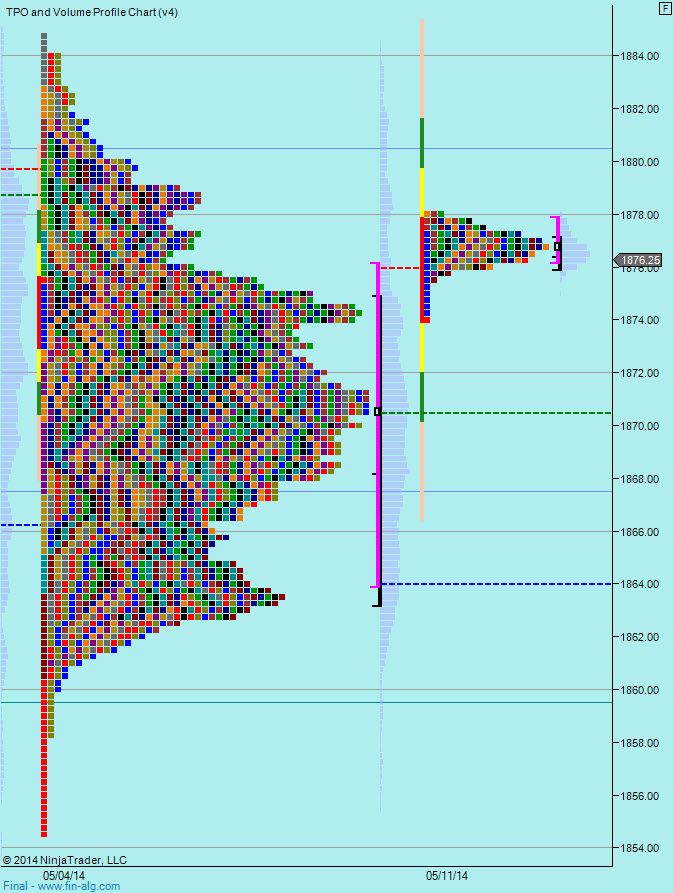
We can see last weeks value area is 1866.25->1879.75. The top is a bit more of a dramatic step than the bottom which really just tapers off. I see the value low from last week as less significant that the value high. The value high is at 1879.50 and we have the old high at 1880.50 - so I 'm looking for a break through that area and potentially a retest from above for a push up. If we can't get through that area, I'll be looking for shorts at least down to 67.50.
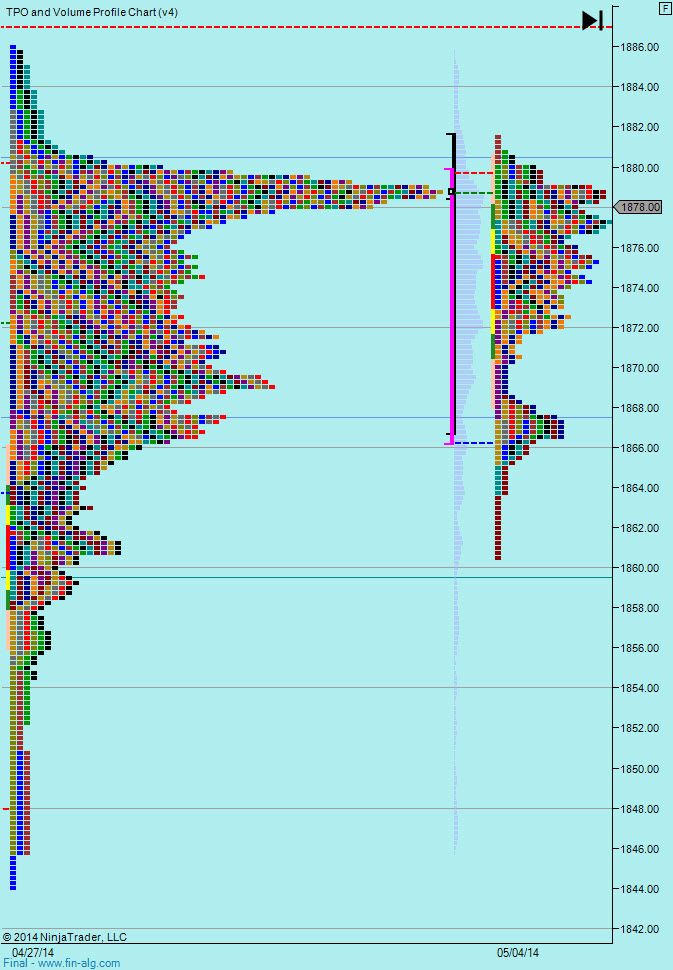
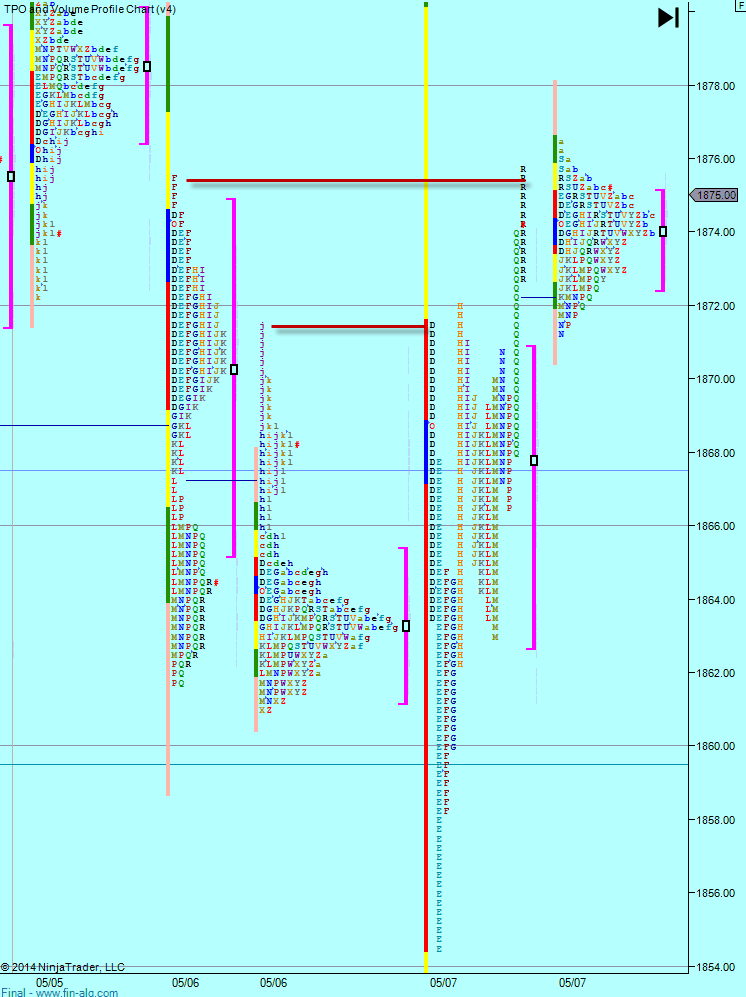
On the split globex/pit profiles, we can see a few significant levels. Yesterdays Value low at 1871.50 would be a good level to get long off but we might not get much lower than the pullback off yesterdays high - we got down to 1875.50 into the close. So I'll be watching both levels today to see if we get signs they are holding. For shorts, I'd rather short a break of 71.50 or a failure to get through yesterdays high at 1880. I'll also be looking at Fridays high for rejection if we make it up there.
Overnight inventory is all long but mostly within yesterdays range, so I'm not expecting a strong counter move off the open unless we go much higher.
All this of course does presume that jet lag doesn't get the better of me & that I'll still be awake when the markets open.
Weekly Numbers
Range - 1844 -> 1886
Value 1866.25 -> 1879.75
S1 1850.50, R1 1892.25
Daily Numbers
Range - 1860.50 -> 1880
Value - 1871.50 -> 1879.50
Globex - 1876 -> 1881.50
The first question that comes to mind today is "are we done?". Have we now completed our price discovery upwards, found nothing there and now due to go back the low 1800's? I think at this point, it's tough to call but the more times the markets try to do something and fail, the more chance the opposite will happen.
We do have a level just below us at 59.50 and the weeks low thus far has been 60.50. So far in the Globex session we've been as low as 61. Below this it doesn't look like much will stop the market till we get to 1839.50. It is quite possible that if we break 59.50 that sellers will jump on and we'll be down at 39.50 very quickly.
There is a lot of chop to the left but we've had plenty of fast spikes down to that area before.
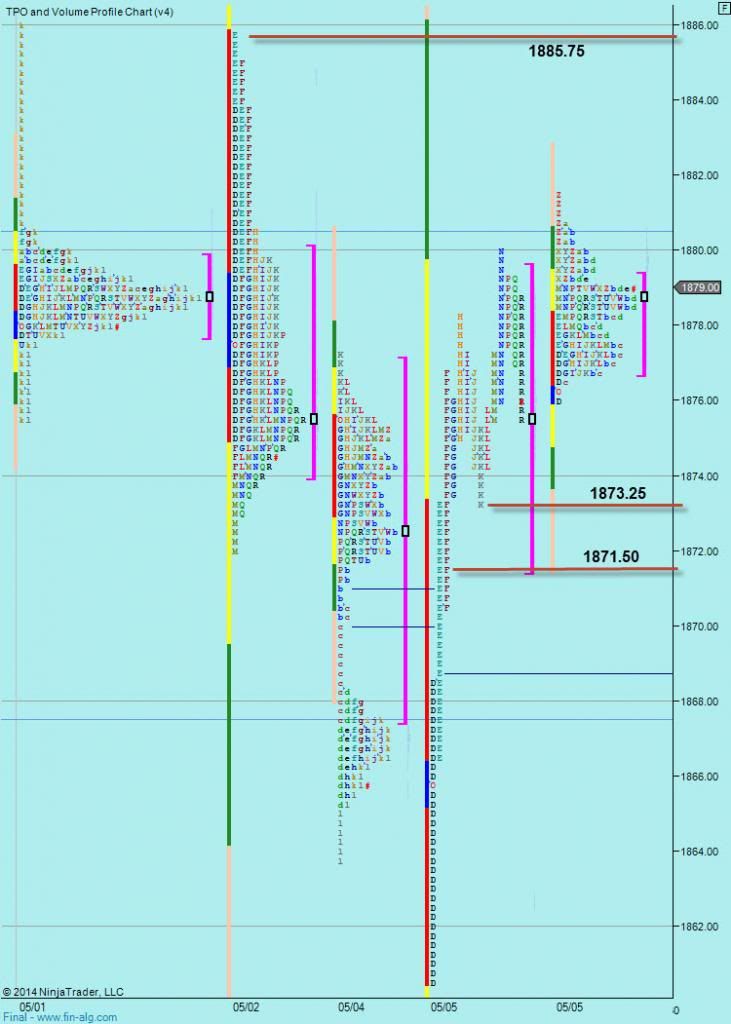
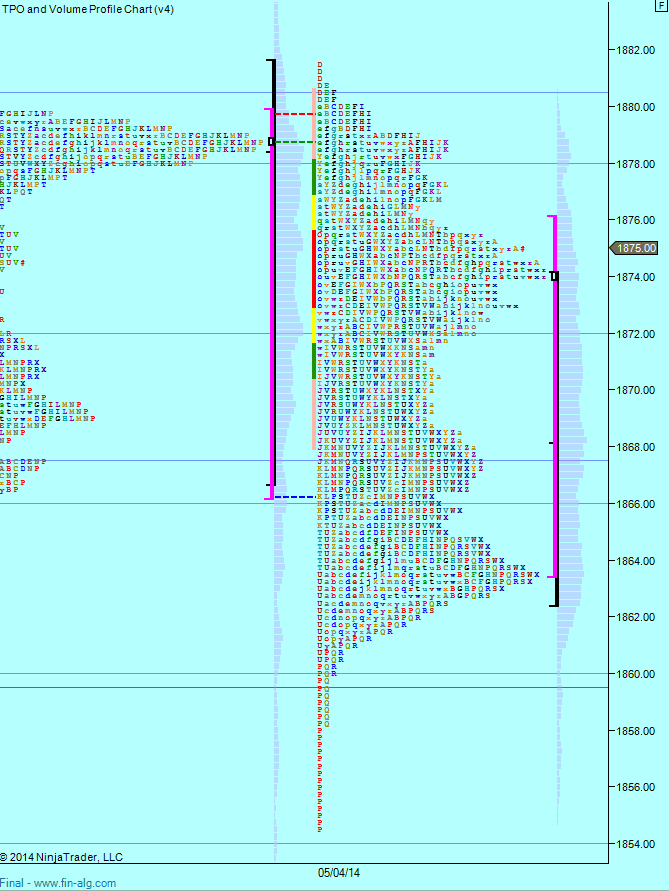
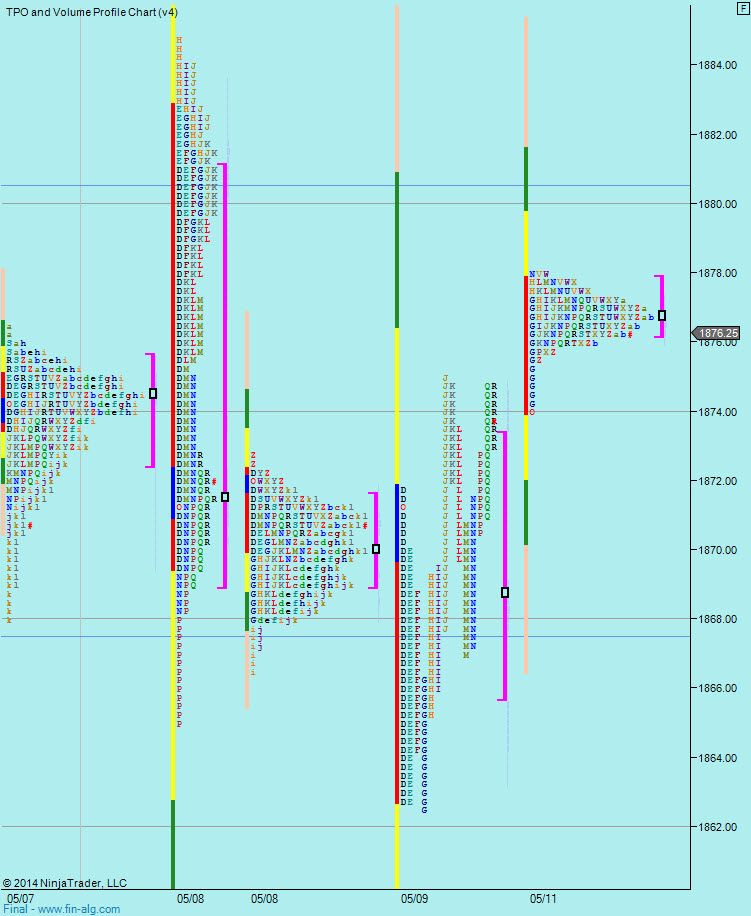
As discussed yesterday, the weekly profile just sort of tapers out to the downside but has a more significant step above - not far off from where the old high of 1880.50 was. We tested that area in the Globex session and now we are testing what is the last "chunk" in the profile below - albeit a small chunk. This is just above our 59.50 area so adds weight to the argument we might accelerate if we start trading below there in the pit session.
just so
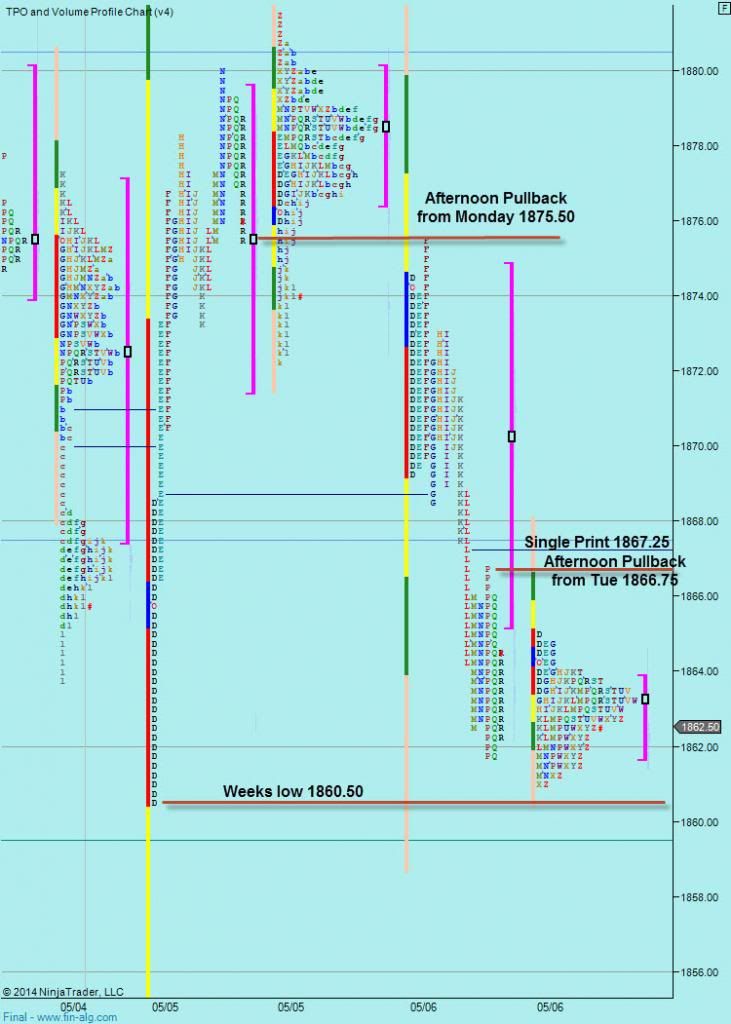
We mentioned yesterday the pullback into the close on Monday to the 75.50 area.
"Yesterdays Value low at 1871.50 would be a good level to get long off but we might not get much lower than the pullback off yesterdays high - we got down to 1875.50 into the close"
Well - a long off it in the pit session would not have been possible as the level broke down in the Globex session. Interestingly though - it did then act as resistance. Obviously people looking @ the gap from the close. If we look at yesterday, we pulled back to 1866.75 after the days low was established and there's a single print at 67.25 too - so this could act as resistance into the open. It could also potentially be our support if the Globex session pops up after in the hours remaining before the open.
Again, we can see how close we are to the weeks low - that 59.50-60.50 area that will likely see sellers step in if it breaks.
So for me a break of 59.50-60.50 is the most significant potential move today. Yesterday started off horribly in terms of chop and so if we move up, I'll be a bit more wary as I'll expect it more choppy to the upside.
Still - Yellen is in the chair at 10am EST - so I'll probably have to throw my prep out the window after that!
Weekly Numbers Range - 1860.50-> 1881.50
Value 1861.25 -> 1875.25
S1 1850.50, R1 1892.25
Yesterday we had our eye on a break of 59.50->60.50 with potential for an extended move, possibly down to 39.50. Well we did get a bit of a run when it broke but then we came back again. The down move was off the back of Ukraine news, so maybe there wasn't "real" size behind the move down. Still - it does show it's becoming a tricky market to call in terms of lines in the sand where you expect people to jump on board.
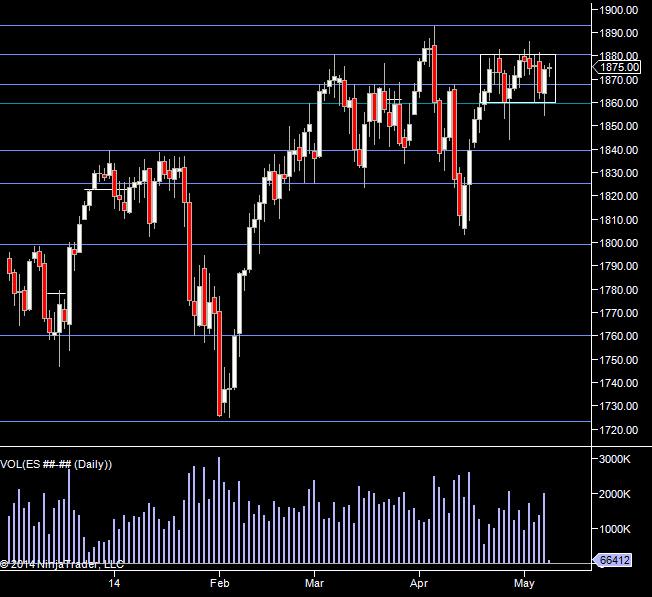
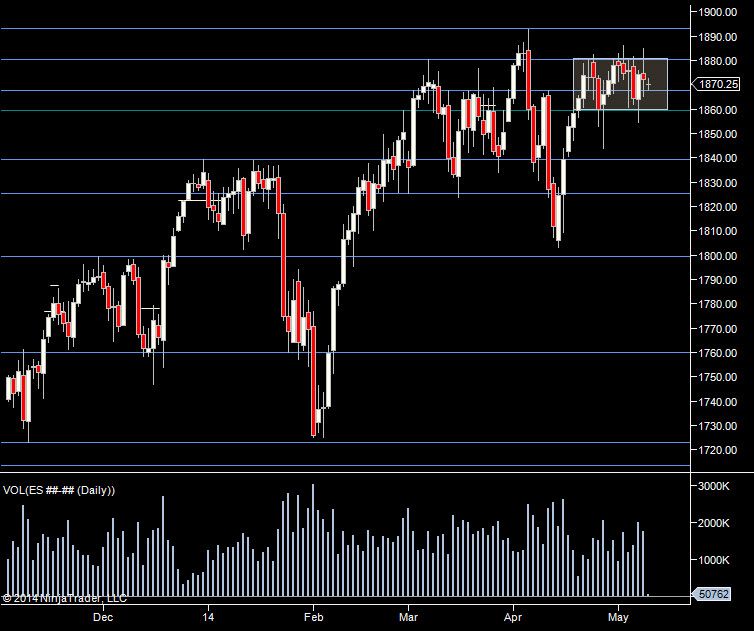
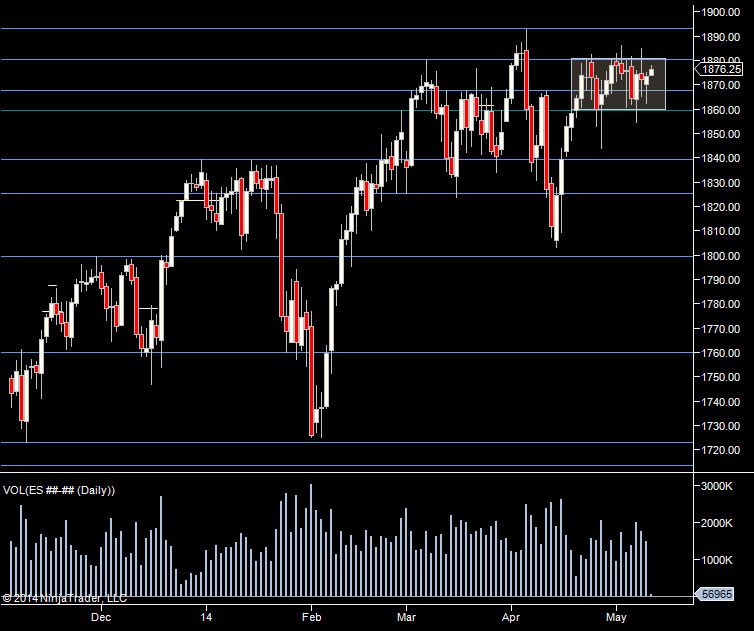
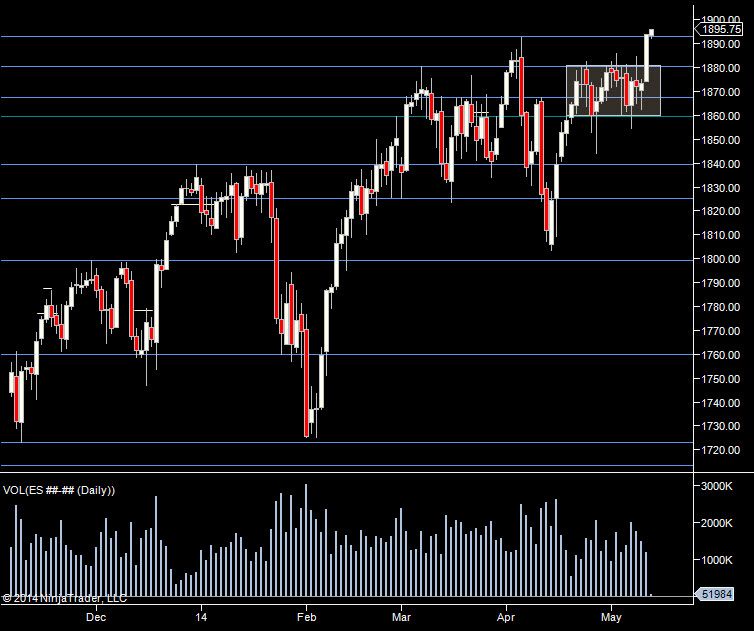
I'm using the daily chart today for long term analysis. Taking a step back, the past 13 sessions have opened/closed in the 1860-1880 range. We have traded outside that but effectively "value" is 60-80 right now, a "micro-range" I guess we can call it. So from a value perspective above 80 is expensive and below 60 is cheap. This is a pretty tight range to be in for almost 3 weeks and so playing the extremes has some risk because of the amount of time we've been here. Still - in a range you fade the extremes.
We will break out at some point and I expect some acceleration when we do but I see no clear indication of which way we will break or when it'll happen. My bias has to be upside because that's the direction it was going before the range.
Anyway the upshot is - 60->80 is value and unless news driven, we will probably have chop in the middle. I blame jet lag for me not spotting this on Monday or Tuesday ;-)
The weekly profile for this week really just confirms the above 60-80 temporary balance/value.
In terms of levels to play off, we are close to 80 in the Globex session, if we do pull back to yesterdays value high of 70.50 - we do have 80 as a potential target and that does give you breathing room to get some off and leave a portion on for the possibility that today is the day the range breaks.
We can see that yesterday we first had the Globex high as resistance, we went down, got thru it 2 ticks before breaking it on the third attempt. So regular intraday levels are worth watching in the middle of this 60-80 range but I am pretty much neutral going into today and not really looking at any level as being exceptional going into this open.
If 80 does break, then look closely for absorption on the offer as we move past 80. If you see it pop through and then lots of buying above around 81.50-82.00 but no move through, the sellers are absorbing and it's another headfake and breakout traders getting caught offside.
For a continuation long trade, I'd want to see us get to 83 at least, then come back to the 80 area for a retest before moving up more. For sure, I would not go long if we just got to 81.50 and came back to 80.
Weekly Numbers
Range - 1854.50 -> 1881.50
Value 1863.50 -> 1876
S1 1850.50, R1 1892.25
Daily Numbers
Range - 1854.50-> 1875.75
Value - 1862.75 -> 1870.75
Globex - 1871.25 -> 1876.50
We are still rotating around the 1860-1880 range. So there's not much to say that we didn't say yesterday. Whilst this range holds, fading the extremes is the best bet but as it's been poking through both sides considerably, I'd wait for the reversals to confirm themselves before fading.
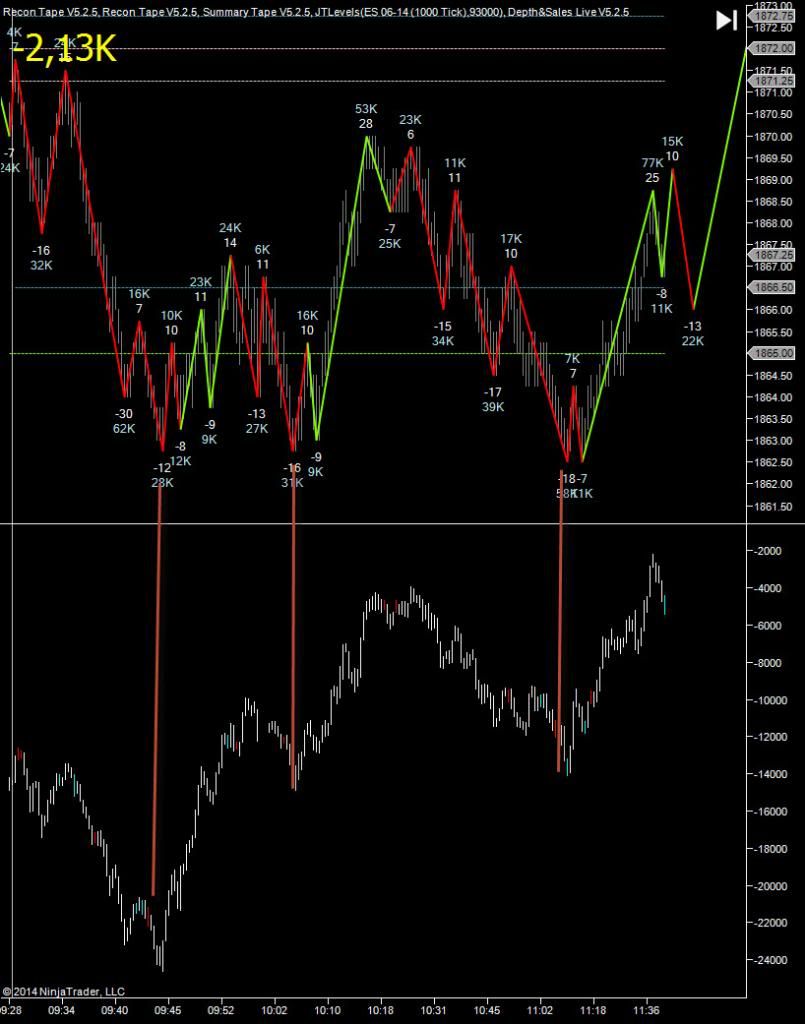
Yesterday we got up to 82.75 and then moved sideways for a while with delta moving down, as we got down to 1878, delta had come off 10k which is usually enough to confirm a reversal. As it was we chopped around where the volume had built on the way up and moved another 2 points through the high before the actual reversal to the lows.
This week the moves have been fairly decent once we revert back to the range. I imagine a lot of people got caught short off the 82.75 reversal yesterday. I don't think there's much you could do about that if you did get caught. We got a move to the extremes, sideways action, then a drop with delta confirming. Just unlucky it took another run to the high before the real move down.
Anyway - same thing today - you can try to play the middle - perhaps off yesterdays VAL or the globex low or you can wait for the extreme. The best trade for me would be a retrace after the range breaks but it's hard to gauge when that will be as ranges always look like they are about to break when we get to the extremes.
Eurex session was really slow today and we may be looking at a slow day.
Weekly Numbers
Range - 1854.50 -> 1884.75
Value 1864.25 -> 1877.25
S1 1850.50, R1 1892.25
Daily Numbers
Range - 1865 -> 1884.75
Value - 1869 -> 1881
Globex - 1868 -> 1872.75
Still in the range, still looking to sell 80's and buy 60's but on a second entry, not the first push.
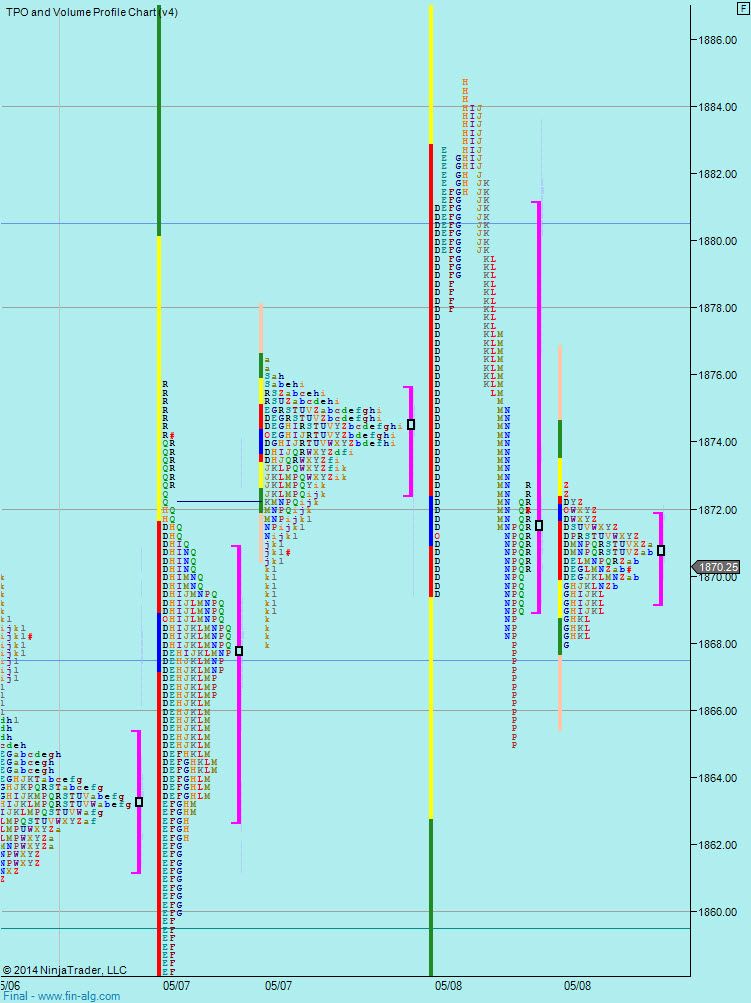
Looking at the weekly profile, it doesn't tell us much other than confirming the 60-80 range, it actually has the value high at 75.50 but I'm sticking with 80 as my personal value high.
The split Globex/Pit profiles also not of much help. We can see the fundamental issue of playing ranges like this. On Friday we got as low as 62.75 in the first hour and then went to 62.50 - so a triple bottom. We basically never made it as far as "cheap" at 60 and below. In this case, we got a triple bottom so actually got second and third chance to enter but still it does show you can't just buy 60 and sell 80 blindly. Next time there it might hit 54 before reversing up.
Here's the triple bottom. We can see that on the second hit, there was very little delta in the pullback to the low, which made that a more attractive trade. For the third hit, there was more negative delta and for that sort of trade and the move that followed it, it was a tougher entry. The delta made it hard to just hit the low (for me) and the subsequent move didn't give a great price to lean on but you can see a small range 64.50-65.75 on the way up.
So again, best trade for me would be breaking this range and coming back for it. Anything in the middle is tricky for the way I trade.
Weekly Numbers
Range - 1854.50 -> 1885
Value 1863.50 -> 1875.50
S1 1857, R1 1887.25
Daily Numbers
Range - 1862.50 -> 1875
Value - 1865.75 -> 1873.25
Globex - 1874-> 1878 (4:50am EST)
Q1 - Other levels are from the 2 hour chart - just areas that have been significant in the past months.
Q2 - I'll get rid of a level when it becomes irrelevant - that usually happens by the market running through it without stopping a number of times. For MP - I only look at yesterdays and last weeks profiles. Last weeks is only relevant int he first 2 days of any week. Then this weeks is more relevant.
If you have any questions about the products or services provided, please send me a Private Message or use the futures.io " Ask Me Anything" thread
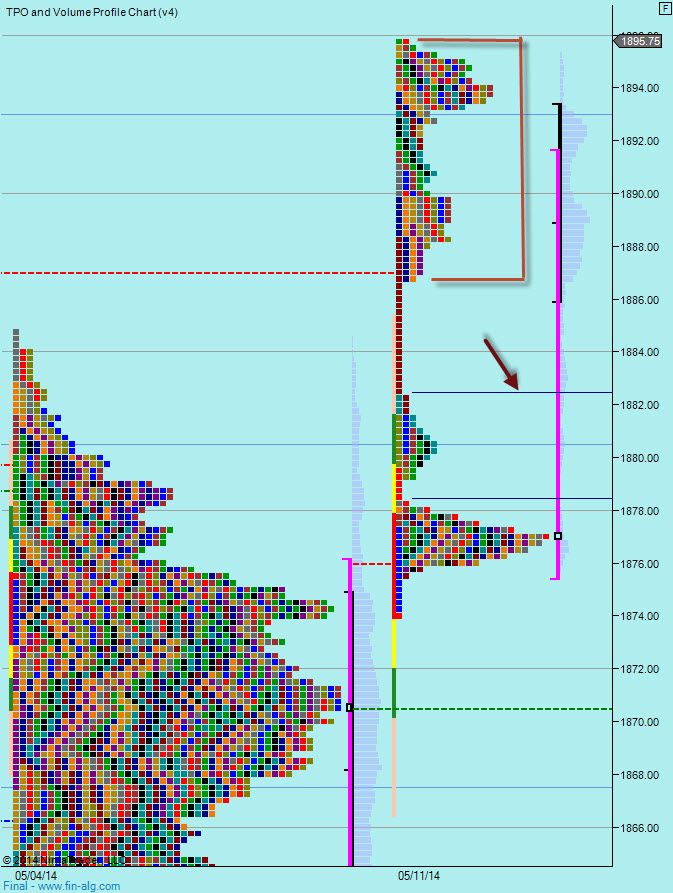
We finally escaped the 60-80 range and poked through the all time high - which is also the top of the larger range. So this is interesting because if we move down now, we could well revert back to the 60-80 range or complete the larger range and be looking at a target of 25.25 and potentially 1800. Still - that's probably something we don't have to worry about intraday today.
In terms of yesterdays action - about 1.2 million traded, so it's not as if a lot of people jumped on either the break of the 60-80 range or the break of the new high. I guess that's 'strike 1' against continuation upwards.
The profile shows is with thin trading below 86.75 with a single at 82. Yesterday we mentioned that
"So again, best trade for me would be breaking this range and coming back for it" - in English I should probably have said "coming back TO it" . That did occur yesterday but today a break of 86.75 should lead to a drop to 82 and then we have another single at 78.50.
If we come down - I'm looking at 80-82 to hold the market for more upside. It's possible that 78.50 could hold it but below that I'll be looking for 60 as a target. If 60 breaks, then we have to consider the larger move down. For today though if it breaks 78.50, I'm looking for 60. If it holds 80-82, I'm looking for new highs.
Of course we do also have potential to hold this upper distribution in the profile with a low of 86.75 - that might have broken by the time we get to the open though but it's worth looking at.
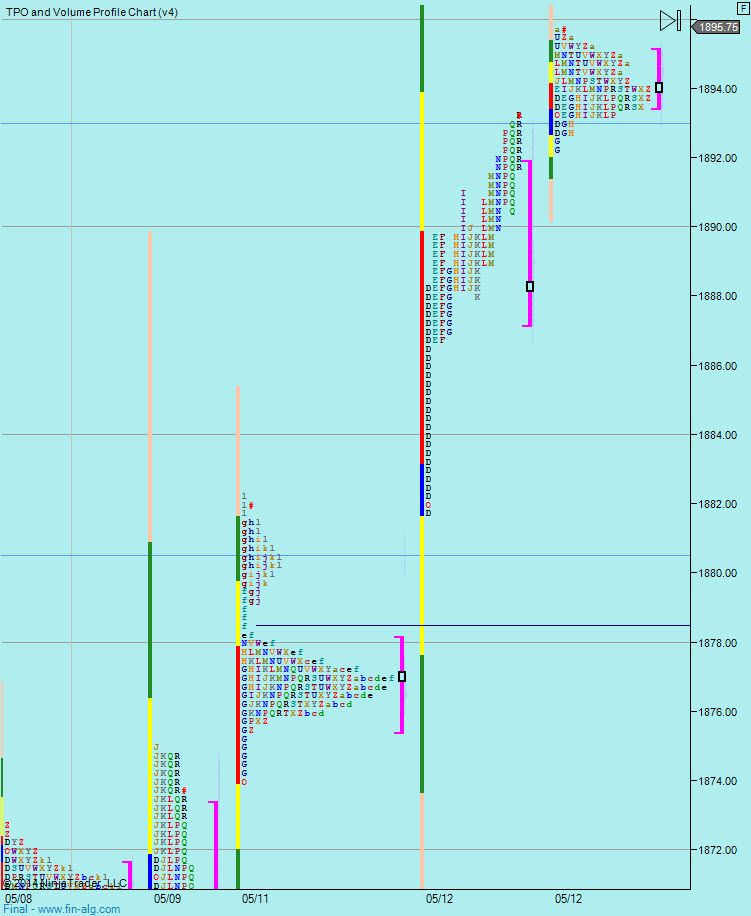
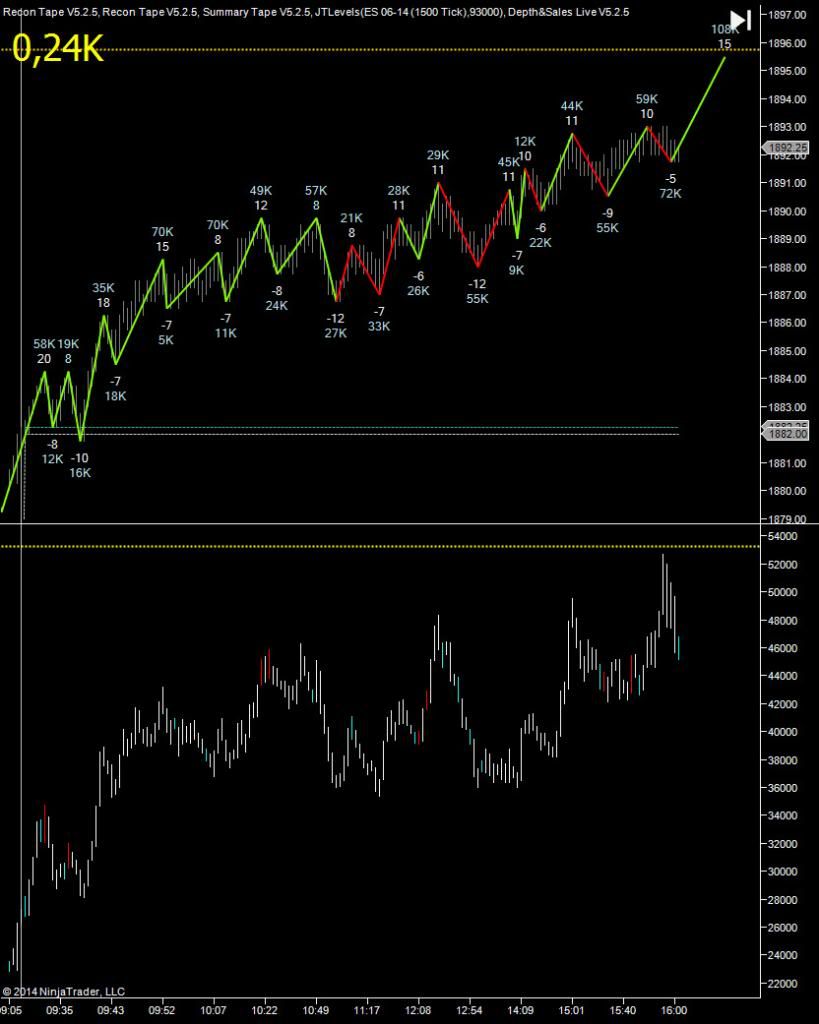
Yesterdays pit session was a grind up and todays globex is mostly above the close so far. That can cause a snap reaction by sellers at the pit open, so watch out for that. It is bullish but with weak volume, I'd actually like to see us build volume ad these prices 86-96 to give us a base for another move up.
If volume was uninspiring yesterday, so was the delta - up about 26k on the day. Pretty lackluster and not indicative of strong buying.
So overall - this move up looks weak. We need to hold 80. If we can hold 80 I'll be happy to go long. Below 78.50 I think the long side looks precarious. If we can build some decent volume at these prices, then that will make me feel more comfortable with going long. Yesterday could just be a big headfake.
Whilst 80-82 is the decider for me I think 86.75 is worth watching too.
Weekly Numbers
Range - 1854.50 -> 1885
Value 1863.50 -> 1875.50
S1 1857, R1 1887.25
Daily Numbers
Range - 1874 (globex)/1881.75(pit) -> 1893.25
Value - 1887.25 -> 1891.75
Globex - 1892.25> 1896.25