Welcome to NexusFi: the best trading community on the planet, with over 150,000 members Sign Up Now for Free
Genuine reviews from real traders, not fake reviews from stealth vendors
Quality education from leading professional traders
We are a friendly, helpful, and positive community
We do not tolerate rude behavior, trolling, or vendors advertising in posts
We are here to help, just let us know what you need
You'll need to register in order to view the content of the threads and start contributing to our community. It's free for basic access, or support us by becoming an Elite Member -- see if you qualify for a discount below.
-- Big Mike, Site Administrator
(If you already have an account, login at the top of the page)
This is more about the charts, but it should be prefaced by saying that this is a bearish step down for equities as can be seen immediately below in the S&P.
Specifically, it�s bearish for the S&P to have crossed below its 50 DMA again considering that similar such crosses in the past have resulted in declines, one rather significant decline back in August, but the true test will be to see whether the S&P closes below its 50 DMA in the days.
One reason to think the S&P will close below its 50 DMA soon is the Rounding Top pattern it is trading in with a target of about 1199 and a pattern shared with the one year view of the Nasdaq Composite below that shows rather clearly just how bearish the 50 DMA dance has been recently and one that it has begun officially having closed below it today.
Its Rounding Top carries a target of about 2490 while its Bear Pennant carries a target of about 2450 and is a pattern showing in the S&P as well and one that is calling for a roughly 5% decline in both indices from current levels.
Not surprisingly the not-shown-tonight Russell 2000 is presenting a similar pattern set-up with its little intraday Diamond in the rough helping out with what could be a decline to about 691 for a 4% decline from today�s close.
What is possible interesting here, however, is the fact that the Dow Jones Industrial Average is still above its 50 DMA.
It raises the question of whether the S&P, Comp and RUT will move up to match the DJIA or whether the Dow moves down to follow those indexes.
Putting aside the fact that three would seem to outnumber one and particularly with two of the leading indices in the former grouping, the CRB Index traded below its 50 DMA days ago and something that should have been caught here in all my bearish zeal and so please accept my apologies around the late notice of what�s shown below.
As can be seen, its Rounding Top pattern is a bit more significant than those showing in the equity indices and points to a potential drop to 360 for a 15% decline from today�s close.
In turn, it may be the CRB Index�s ongoing and bearish flirtation with its 50 DMA shown by its lower highs that may offer caution around the 50 DMA dance coming back into style for equities.
Can you help answer these questions from other members on NexusFi?
Looks like the areas I picked to look at today were valid but not worth much at all so I hesitate in posting the areas I'm looking at for tomorrow. I said 742.5 was a spot that had a slim chance of getting hit...it did not but as it turns out it did have more pull to that area than I thought and did get close...in other words that skewed my plan. The daily Ichimoku is still bullish but I expect a little more dowside. Tonight it may crawl up to about 721.5 and then roll over and go through todays low and end up around 706.5. My official guess for tomorrow is get some kind of move up (after 706.5 gets hit)then down after the turn and finish the day at whatever lows we get....we'll see
I wish I could pick a direction here but I can't really.....could go either way. I guess I will focus on 727 on the topside and the 695 area on the downside. It's not worth posting a chart at the moment....nothing that exciting.
A note to the less experienced out there...be careful tomorrow it has the potential to be really goofy.
The charts were so static today with DXY and EURUSD trading sideways to put off what�s going to be a decent break at this point that there was little worth reporting on with the exception of the XLF and its intraday Bear Pennant.
Interestingly, though, by the close and despite EURUSD holding about flat, the XLF started to confirm this Bear Pennant with a target of $11.80 and something that comes safely at $12.48 and a level that would serve to confirm its Rounding Top with a target of $11.50. It invalidates itself only if the XLF trades above $12.95 and something that should be watched for considering the mixed messages in risk as noted last night.
As interesting as the XLF�s Bear P starting to confirm on the close was the fact that this pattern is now showing in the daily chart too and something that probably supports the possibility of its fulfilling to the downside to some degree.
It is worth noting, however, that the equity indexes are not showing Bear Pennants but rather bearish appendage patterns and this is true even of the Russell 2000 that closed up by more than 1.0% today.
It appears to be trading in some sort of a Bear Flag that confirms at 716 for a target of 684 and just below the 691 target of its unmarked Rounding Top and just above the bottom target of its bigger Bear Pennant at 672 with the XLF needing to take out 737 to the upside to invalidate these bearish aspects.
All in all, though, the Russell 2000 is well-armored with bearish patterns as are the other equity indexes with perhaps the XLF�s Bear P going daily providing some indication that the round down in risk may continue tomorrow.
Here we are back at the KS (705), .....698 might produce some kind of bounce and there are a few spots in between that and 680ish but I still have not written off some upside tomorrow...I'd like to see a rise up to about 724.
I guess I want to focus on 698 (might go a little beyond that but....)and see what happens there as well as 714 -716 area on the upside to give an idea whats in store. There is a possibility that it just rises from 705 to one of the above mentioned areas then drops......
Last thought...keep an eye on 710 as well, could roll over there too
The centrally-managed rally of March 2009 is over; reality is finally intruding on the manipulation and propaganda.
A good way to generate hate mail is to question 1) Santa's "guaranteed year-end rally" and 2) the notion that market rallies always resume soon enough because of the Federal Reserve's backstop/intervention.
If we step back from the latest shuck-and-jive data from the [COLOR=#0000ff]Ministry of Propaganda[/COLOR], a.k.a. the Status Quo managing perceptions, and take a longer view of the economy, money, credit and the stock market, we get an extremely troubling set of insights.
Courtesy of this site's Chartist Friend from Pittsburgh, here are three charts that completely undermine the fantasy that central planning/intervention can "save the market" once again in 2012 and beyond.
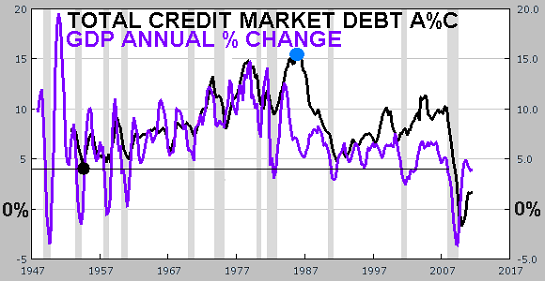
The first chart depicts annual percentage of change of Total Credit Market Debt and GDP. The black line tracks the annual percentage expansion of debt and the purple line shows the annual percentage of change in the Gross Domestic Product.
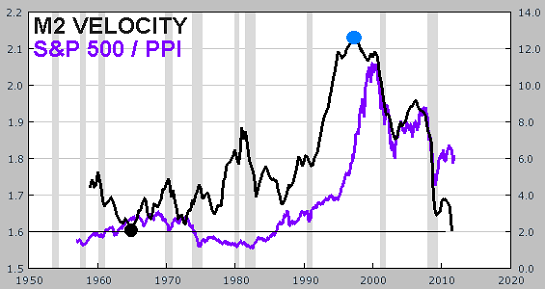
The second chart shows the velocity of M2 Money Supply and the S&P 500 (SPX) stock market index divided by the PPI (Producer Price Index). Velocity of money can be illustrated with a simple example: if the Federal Reserve creates a dollar out of thin air and a bank parks that digital dollar in its reserves, the velocity of that money is very low. If that dollar is lent out and spent at a business that then uses it to buy goods and services at another business where it is paid out as a wage that is spent, and so on, then the velocity of that money is high.
Dividing the SPX by the PPI is a way of adjusting for base inflation. This gives us a more accurate snapshot of reality than a nominal or unadjusted number.
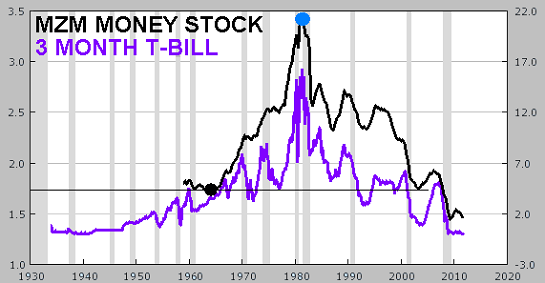
The third chart presents the [COLOR=#0000ff]MZM (money zero maturity) Money Stock[/COLOR], a measure of supply of financial assets, and the 3-month T-Bill (Treasury bond) which reflects interest rates.
Here is our Chartist Friend from Pittsburgh's summary of the charts' fundamental meaning:
I think these three charts together do a good job of showing the correlation between the dynamics of money/credit and the real economy as measured by GDP, stock prices and interest rates. They paint a very clear picture: the economic contractions that we are experiencing today began roughly twenty years ago, and soon a full blown deflationary depression will be delivered.
Thank you, CFFP for sharing these excellent charts.</B> I am adding a bit of commentary after each chart.
Note that GDP more or less tracked credit expansion until around 1979, often exceeding debt as the expansion of credit sparked real growth via investment in productive assets. In the inflationary 1970s, both credit and GDP rose. In 1986-87, credit exploded, leaving the real economy in the dust.
From 1991 on, credit tended to expand at a much higher rate than the real economy, a trend that accelerated in the 2003-07 housing/credit bubble. This reflects the saturation or exhaustion of debt as a driver of growth, i.e. mis-investment in unproductive assets such as McMansions in the middle of nowhere.
Since 2009, GDP hasn't recovered to ite previous annual rates of change, and credit fell to a negative number, i.e. credit contraction, for the first time in the postwar era. It has since regained positive territory but the expansion is weak; simply put, people either don't want to borrow more or they can't borrow more.
The velocity of money rose in the stagflationary 1970s, even as stocks yielded negative returns when adjusted for inflation, i.e. to real returns. Velocity declined in the mid-1980s and then exploded higher in 1990s, topping out several years before the stock market topped in 2000.
Velocity and stocks were highly correlated from 2000 to 2009, when the market staged a sharp rebound even as velocity continued down to a historic low. This suggests stocks have some catching up to do with velocity, that is, the S&P 500 should decline significantly.
Many people have noted the explosive rise in money supply (not shown) since the 2008 financial crisis; this chart shows that this "new money" isn't entering the real economy at all, as money velocity has plummeted to zero.
This third chart shows a rough but long-term correlation between T-Bill yields (interest rates) and the supply of financial assets (money stock). The stock of money fell off a cliff in 2000, and that marked the highs in both the S&P 500 and the T-Bill yield.
Maybe near-zero interest rates aren't the panacea the Federal Reserve thinks they are.
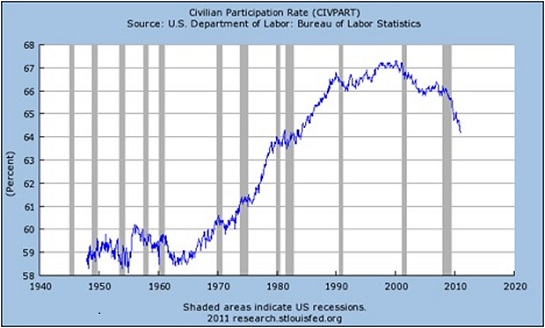
If we look at civilian participation in the workforce and other basic measures of employment, we find they topped out
in 2000 as well.
If there is any evidence of a resurgence in the real economy just ahead, it isn't present in these charts. Any stock market rally in 2012 will not reflect the real economy, credit, money stock and velocity or employment visible in these charts. Until these charts shows positive fundamental improvement, a rally can only be smoke and mirrors, a trick of central planning manipulation that is unlikely to last longer than a sugar high
So much for some more downside today....anyway, this is the daily chart showing price back above the cloud.
The KS held it yesterday and here we are. It looks like 3 more days and the chikou will be above price if it can stay in this area or higher. We've got a long in play soon if it all holds, the only concern is that the future cloud has just about disappeared and might even turn bearish so we will have to wait and see.
I had traded the last 2 holiday sessions with a live account. NEVER AGAIN. NEVER EVER EVER AGAIN.
I made one trade while I was visiting in Vegas without a stop. I left for an hour and on something that I usually would make or break 300 bucks I came back to a 15K drawdown! (exited at -11K)
Holiday trading is for people who really like to challenge themselves in my opinion. It could go up, down, all-around for the next 2 weeks and I don't think it will surprise anyone. For me, I will wait to see what happens at the end after Jan 1, and see if there is a BO play or some other form, but I am not live anymore so take it for what it is worth, little to nothing.