|
Manta, Ecuador
Site Administrator
Developer
Swing Trader
Experience: Advanced
Platform: Custom solution
Broker: IBKR
Trading: Stocks & Futures
Frequency: Every few days
Duration: Weeks
Posts: 50,469 since Jun 2009
Thanks Given: 33,246
Thanks Received: 101,669
|
Now that NinjaTrader 7 features a Monte Carlo simulator, I was wondering if the math majors in the forum could help me better understand the appropriate way to use it and incorporate it into my trading.
As you probably know, I suck at math.
I could use some real world examples, as the NT7 help doesn't spell it out enough for me to grasp it seems.
This is from the NT7 help guide:
What is Monte Carlo Simulation?
Monte Carlo Simulation is a mathematical technique that uses repeated random sampling to compute a range of possible results with their respective probability. NinjaTrader runs Monte Carlo Simulation by randomly combining the trade results in a defined series of simulations. A graph of the results are plotted with the statistic values or Profit/Loss on the Y - axis and the probability on the X - axis as a percentage.
Why use Monte Carlo Simulation?
Although a backtest of a NinjaScript strategy may produce profitable results, those results may have just been due to good luck. In real life, you may have a string of bad trades that can wipe out the account before the good trades appear, therefore it would be helpful to understand the probability of such a string of bad trades. Monte Carlo Simulation will randomize your trade results over and over again in multiple simulations to provide you with a normal distribution of simulation performance. The trader can use this information to see the top or bottom percent of trades (outliers) that will cause the most variability in the strategy as well as the most statistically probable results.
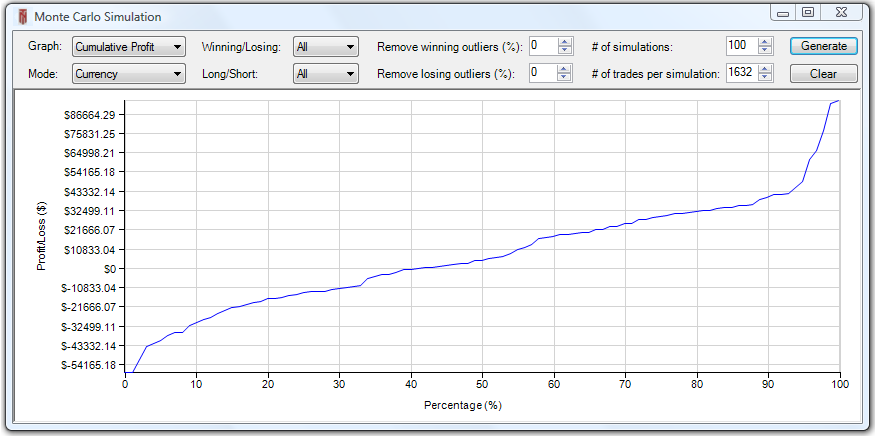
X-Axis
The horizontal axis of the Monte Carlo Simulation graph shows the percentage of simulations that have fallen below the Y - axis value. For example, if you run a Monte Carlo Simulation setting the # of Simulations to "100" and using the Cumulative Profit graph, the intersection of the 50% X - value and the associated Y value means that 50 of your simulations will be below that cumulative profit/loss value, and oppositely the remaining 50 simulations will have a greater cumulative profit/loss.
Y-Axis
The vertical axis of the Monte Carlo Simulation graph displays the measured unit for the Graph item selected such as Profit/Loss, statistical information, or time.
Mike
|


