NexusFi: Find Your Edge


Home Menu


DAX footprint on tradingview


Discussion in Platforms and Indicators

Updated
    1. trending_up 3,293 views
    2. thumb_up 2 thanks given
    3. group 1 followers
    1. forum 1 posts
    2. attach_file 2 attachments


Search this Thread

DAX footprint on tradingview

  #1 (permalink)
 ft61 
Vienna Austria
 
Experience: Intermediate
Platform: NinjaTrader
Broker: IQFeed / Continuum
Trading: NQ
Posts: 14 since Jul 2013
Thanks Given: 20
Thanks Received: 28


Dear all,
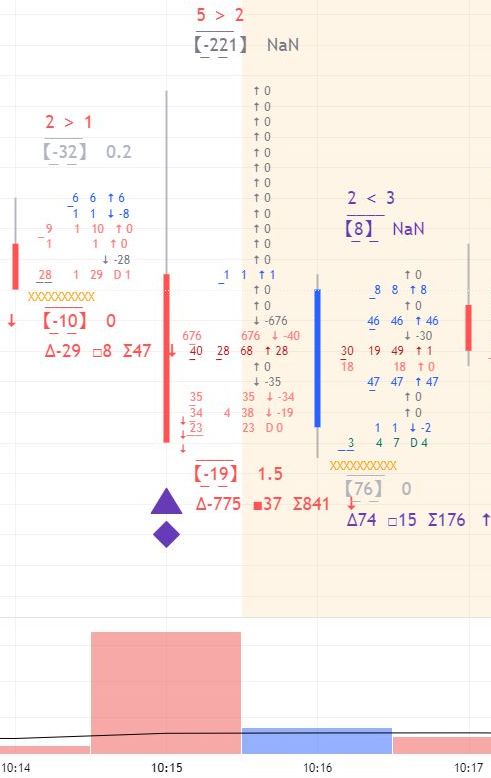
currently I am testing available footprint indicators on tradingview. However, I have some doubts about the correctness of volume data shown at each price level. For example, in the screen shot from Nov. 11th 2022 10:15 CET, a one minute candle (O 14253, H 14265, L 14242, C 14242) for the DAX did not show any trade above the open price of 14253 while there was an unusual high amount (676 contracts) traded at 14249. It would be great, if someone could confirm (or invalidate) this data.
If my interpretation is correct, then the candle opened with a buy of a single contract at 14253. At this time the order book must have been empty on the ask side up to 14265 which makes the high of the candle. Then there was an aggressive sell at 14249 and price moved further down subsequently.

Started this thread Reply With Quote
Thanked by:

Can you help answer these questions
from other members on NexusFi?
What broker to use for trading palladium futures
Commodities
Cheap historycal L1 data for stocks
Stocks and ETFs
About a successful futures trader who didnt know anythin …
Psychology and Money Management
Pivot Indicator like the old SwingTemp by Big Mike
NinjaTrader
ZombieSqueeze
Platforms and Indicators
 
  #2 (permalink)
 ft61 
Vienna Austria
 
Experience: Intermediate
Platform: NinjaTrader
Broker: IQFeed / Continuum
Trading: NQ
Posts: 14 since Jul 2013
Thanks Given: 20
Thanks Received: 28

I have done some testing to see the difference in footprint charts when using different software with different data feeds (NT with IQFeed and Lenz+Partner, Tradingview with EUREX real time data).
The table shows the same one minute candle for the different setups. Interestingly the volume is the same for all scenarios and appears to be correct. However, the number of contracts traded at each price level differs significantly. While NT/IQFeed/L+P show at least the same volume at the same price level there’s a noticeable difference between bid and ask side. Tradingview is obviously not the best choice when using footprint analysis.


Started this thread Reply With Quote
Thanked by:


Last Updated on November 20, 2022


© 2024 NexusFi™, s.a., All Rights Reserved.
Av Ricardo J. Alfaro, Century Tower, Panama City, Panama, Ph: +507 833-9432 (Panama and Intl), +1 888-312-3001 (USA and Canada)
All information is for educational use only and is not investment advice. There is a substantial risk of loss in trading commodity futures, stocks, options and foreign exchange products. Past performance is not indicative of future results.
About Us - Contact Us - Site Rules, Acceptable Use, and Terms and Conditions - Privacy Policy - Downloads - Top
no new posts