|
London/UK
Experience: Intermediate
Platform: NT7
Broker: Continum
Trading: ES
Posts: 11 since Aug 2015
Thanks Given: 3
Thanks Received: 7
|
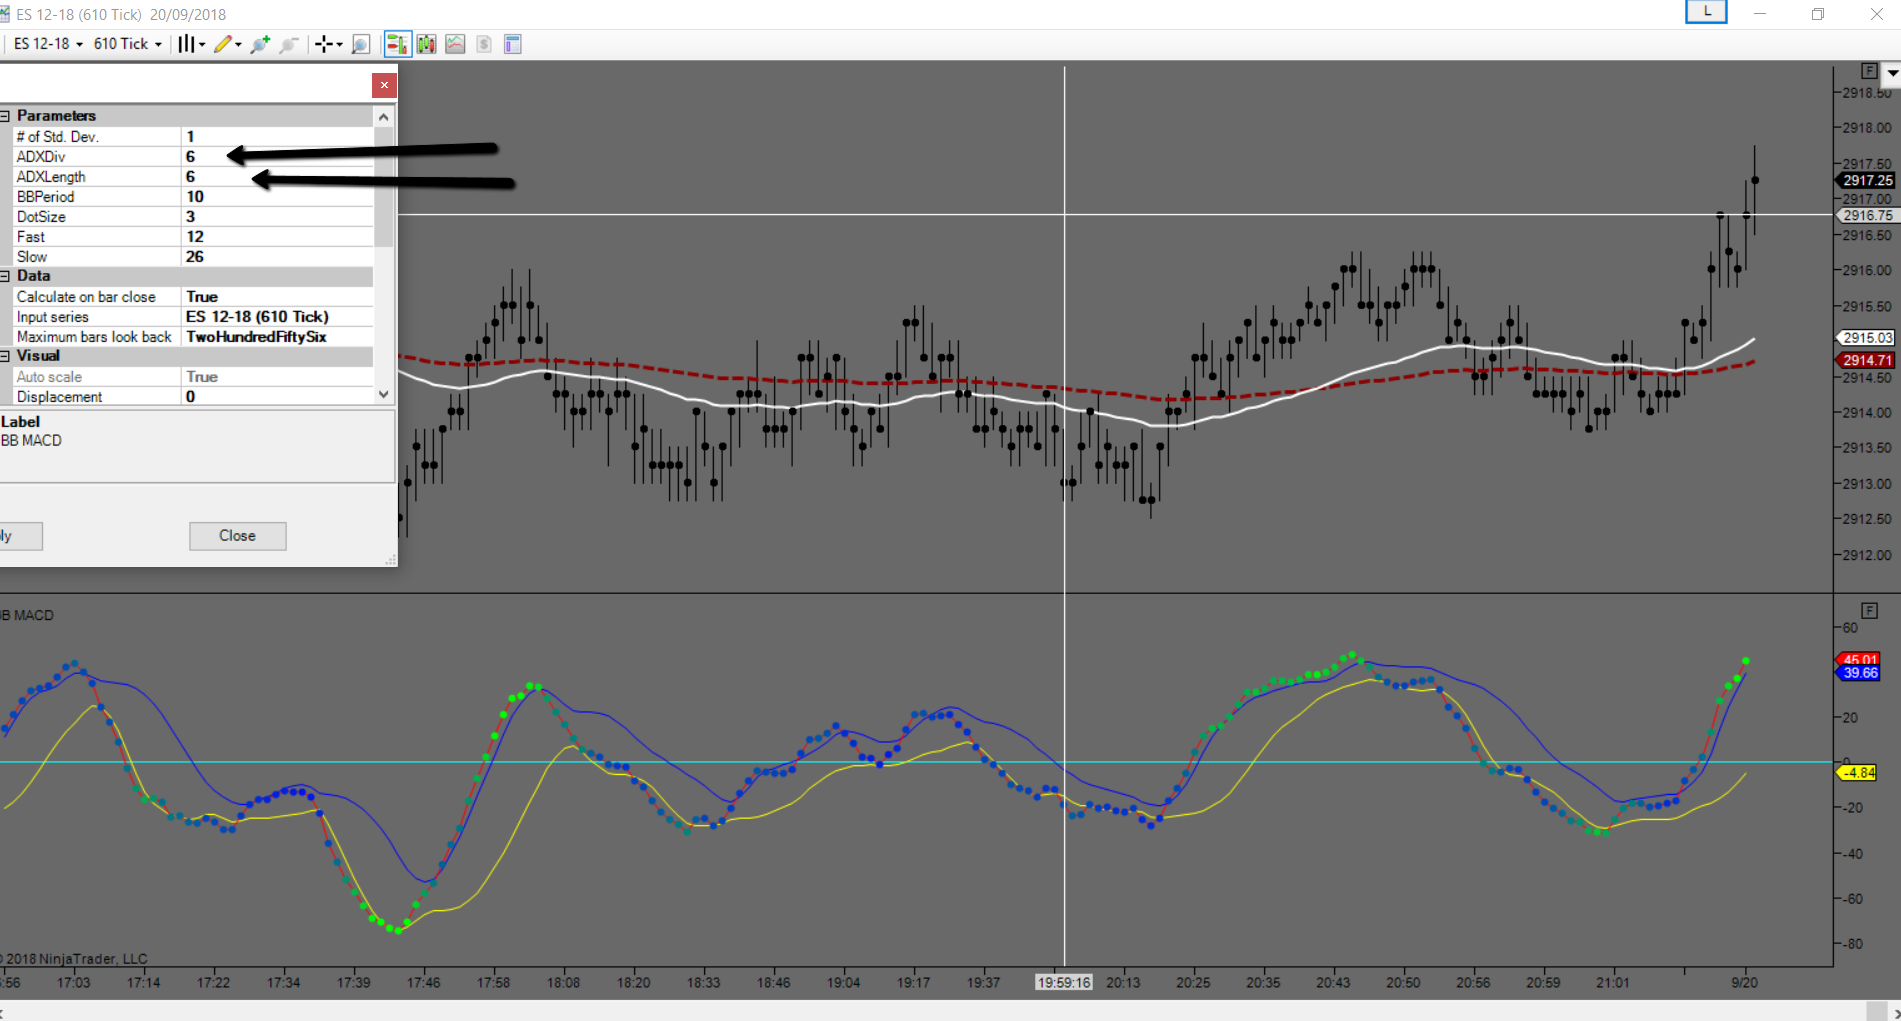
Hello Traders, I have been trading with BB Macd's for a long time and recently come across a NT Macd indicator that has ADX parameters, image attached. The parameters are ADX Div and ADX length.
This particular indicator will change the colour of the BB's and I believe that is from the ADX parameters so I am trying to understand these colour changes and how best to interpret them.
As I understand ADX it is a trend strength indicator and the Macd is a momentum indicator but if anyone could help with how to interpret what the colour changes on my image are actually showing, for example on the image I have blue and yellow and fading shades of both colours sometimes one colour going up with price or sometimes the alternate colour also going up with price how is that to be understood ? Also with the various shades of colour going from weak to stronger, I understand that to be trend strength but why can it be blue or yellow in the same direction?
Any help with this is greatly appreciated.
|


