Welcome to NexusFi: the best trading community on the planet, with over 150,000 members Sign Up Now for Free
Genuine reviews from real traders, not fake reviews from stealth vendors
Quality education from leading professional traders
We are a friendly, helpful, and positive community
We do not tolerate rude behavior, trolling, or vendors advertising in posts
We are here to help, just let us know what you need
You'll need to register in order to view the content of the threads and start contributing to our community. It's free for basic access, or support us by becoming an Elite Member -- see if you qualify for a discount below.
-- Big Mike, Site Administrator
(If you already have an account, login at the top of the page)
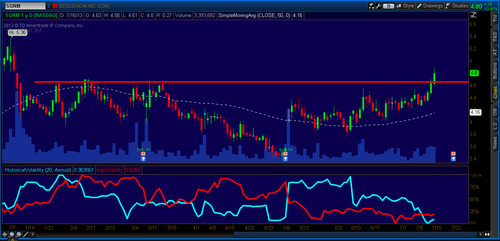
I don't know if thinkorswim has IV and HV together in an indicator, to save space I combined them a while back and added some labels to it. Also attached is something like the ones they use on tastytrade with the IV Rank and Price Change on top. The IV_Rank_SD study above the green line is high vol, below the red line low vol.
I continue to recommend running some HVs on a longer time series because I think it's important to know what happened during the worst of 2008-2009, and then during spots of 2010-2011 (Euro/Greece/US Debt), but the reports found at the above link (they include percentiles) are a good place to get your feet wet.
Up for some air because I have a question...
I have seen two different (so far) methods for reviewing HVOL.
One calls for using continuous charts (or also called Long Term Daily chart). I assume these types of charts are a compilation of front months with which I can strip the last 10 DTE if I desire.
Another method is to just simply use only the front month.
This is the same issue those who trade the underlying using technical analysis face; there are several methods to constructing a continuous contract and fierce opinions on which one is best.
I don't think there is a single, correct HV measurement for all markets. In a period of relatively stable volatility, a continuous front month might work fine for most markets but what about these examples --
1. Silver or Gold if the data service uses 'front months' that the market ignores and puts all the liquidity elsewhere. In SI for example, Mar, May, Jul, Sep, Dec are active even though...
Trading is conducted for delivery during the current calendar month; the next two calendar months; any January, March, May, and September falling within a 23-month period; and any July and December falling within a 60-month period beginning with the current month. https://www.cmegroup.com/trading/metals/precious/silver_contract_specifications.html
2. The Jul/Sep, Sep/Dec or Sep/Nov contract rollovers in corn and soybeans and several of the contract rollovers in hogs frequently have large price gaps and may have large volatility differences, too.
3. Nat Gas today where short term HV in Mar is 100%, there are still at least ten days to go in the options and future, but if you use Apr the short term HV is about 40%. That said, I think Nat Gas and Crude Oil, since they are extremely liquid and have 12 contracts per year (as opposed to the grains) can be good candidates for a Continuous front month or Continuous second month most of the time.
I sometimes use three price series - Continuous 1st, Continuous 2nd, and specific month - and whatever series I use, I think it's important to run HVs in a couple of of increments out to at least 90 or 100 days, especially if you're trading longer dated options.
At the risk of stating the obvious, keep in mind that HV is backward looking (previous volatility), and IV is forward looking (anticipation of future volatility as reflected in the the option premium). So comparing IV to HV is not always helpful because the time periods are out of sync. Comparing IV to your forecast of future volatility might make more sense.