NexusFi: Find Your Edge


Home Menu


Selling Options on Futures?


Discussion in Options

Updated
      Top Posters
    1. looks_one ron99 with 2,221 posts (4,489 thanks)
    2. looks_two SMCJB with 346 posts (733 thanks)
    3. looks_3 kevinkdog with 341 posts (400 thanks)
    4. looks_4 myrrdin with 288 posts (408 thanks)
      Best Posters
    1. looks_one SMCJB with 2.1 thanks per post
    2. looks_two ron99 with 2 thanks per post
    3. looks_3 myrrdin with 1.4 thanks per post
    4. looks_4 kevinkdog with 1.2 thanks per post
    1. trending_up 1,934,752 views
    2. thumb_up 9,259 thanks given
    3. group 458 followers
    1. forum 7,370 posts
    2. attach_file 794 attachments


Search this Thread

Selling Options on Futures?

  #5231 (permalink)
 jokertrader 
NYC, NY
 
Experience: Intermediate
Platform: Sierra, TT
Broker: N/A
Trading: Spread Researcher and crypto degen
Posts: 654 since May 2013
Thanks Given: 545
Thanks Received: 360

TOS can use Thinkback for Stocks (go back in time and allow to create a simulated strategy) and walk forward with adjustments - this does not work for futures options

No way in IB Risk navigator i know of> I changed the date to past in what If but that didnt give me any accurate info

What abt CQG Qtrader or other tools where we can do backtesting for futures option strategies?

thanks

Visit my NexusFi Trade Journal Reply With Quote

Can you help answer these questions
from other members on NexusFi?
My NT8 Volume Profile Split by Asian/Euro/Open
NinjaTrader
Request for MACD with option to use different MAs for fa …
NinjaTrader
ZombieSqueeze
Platforms and Indicators
NexusFi Journal Challenge - April 2024
Feedback and Announcements
 
Best Threads (Most Thanked)
in the last 7 days on NexusFi
Retail Trading As An Industry
67 thanks
NexusFi site changelog and issues/problem reporting
47 thanks
Battlestations: Show us your trading desks!
43 thanks
GFIs1 1 DAX trade per day journal
32 thanks
What percentage per day is possible? [Poll]
31 thanks

  #5232 (permalink)
 HardSwap3 
 
Posts: 20 since Jul 2014


rsm005 View Post
Wondering if oil found a floor in the high 20s.

/rsm005/

I think so, but only temporarily. My cycle analysis timed the bottom perfectly, and indicates a 2 week rally to Friday Feb. 5th, then a resumption of the decline.

Reply With Quote
  #5233 (permalink)
 HardSwap3 
 
Posts: 20 since Jul 2014


ron99 View Post
To me it looks like almost all of the markets are too volatile to be selling options.

In my opinion and 30 years of trading experience, high volatility is actually the absolute best time to be selling options, as premiums are very inflated.

Reply With Quote
  #5234 (permalink)
 ron99 
Cleveland, OH
 
Experience: Advanced
Platform: QST
Broker: QST, DeCarley Trading, Gain
Trading: Options on Futures
Posts: 3,081 since Jul 2011
Thanks Given: 980
Thanks Received: 5,785

Amazing how often March CL bottoms right when the Feb contract expires.

Started this thread Reply With Quote
The following user says Thank You to ron99 for this post:
  #5235 (permalink)
 rsm005 
vancouver BC/Canada
 
Experience: Beginner
Platform: Zaner360, OX
Broker: DeCaley
Trading: options
Posts: 264 since Jan 2015
Thanks Given: 13
Thanks Received: 205

@ron99

Hey Ron I hope you're doing well. I wanted to put together a quick test to see how your two trading methods Would hold up during this latest market downturn.


As you can see, the naked position actually held up a whole lot better than the spread. But neither one of them would have forced an exit although the spread came precariously close a few days ago.

The spread is the column on the right. So this raises a rather interesting question. Over the past six months there have been two market moves that have put both methods of trading to the test. In one scenario, the naked put fails and in the other scenario the spread fails..... for the sake of this argument let's just assume that's what happened instead of hitting 97% initial margin.

Is there any scenario where you would consider using the naked puts as opposed to the spread going forward?

/rsm005/

Reply With Quote
The following user says Thank You to rsm005 for this post:
  #5236 (permalink)
 jokertrader 
NYC, NY
 
Experience: Intermediate
Platform: Sierra, TT
Broker: N/A
Trading: Spread Researcher and crypto degen
Posts: 654 since May 2013
Thanks Given: 545
Thanks Received: 360


ron99 View Post
This post will explain how to use the tracker sheet and my ES sheet.

On the Tracker sheet in cell G1 is the date that will be used if you click Track Select (cell C1) or Track Spread (cell D1). If you have the risk file for last Friday downloaded and in your C:\Span4\Data folder then put 20151218 in cell G1.

On the Tracker sheet I have listed in row 3 a naked short option ESh6p1650. The Net column has a -1 meaning one short contract. Positive numbers in the net column are for long options.

The number 1 in the S1 column is for grouping strategies. This naked option is in group 1 without any other options.

In row 4 I have the same short option and in row 5 I have two long ESh6p1350 options.

The number 2 in the S1 column for rows 4 & 5 tells the program to combine them together as a spread.

Click on Clear Hist Data in cell N2 to clear the HistData sheet.

If you select cells A3, A4 & A5 and then click Track Select (cell C1) you should get this.


Row 3 shows $1,420 IM for the naked option.

Row 4 shows $637 IM for the spread.

The HistData sheet shows the raw data for what you just calculated. I added columns AI to AP to the original excel so that more calculations could be done to the data.

(Note I have had trouble with getting results on the HistPivot sheet if cell AI1 is blank. That usually happens when I change contracts on the Tracker sheet. If the data on the HistPivot sheet didn't update then check to see if there is a number in cell AI1. If not the put a number in this cell and then on the HistPivot sheet right click on any data that is there now and the left click on Refresh.)

To run historical research on an option or spread
  1. Go to Tracker sheet
  2. Put the starting date (format YYYYMMDD) in cell G1. Use one trading day before you are adding the position. So if you want the position to start on 11/30/15 then put 11/27/15 in cell G1. The reason for this is that when you are looking to add a position today the IM you will have is the IM from the prior trading day.
  3. In cell H1 put the ending date for the research.
  4. Click on Clear Hist Data in cell N2 to clear the HistData sheet.
  5. Left click cells A3 and then hold the left click and drag down to cells A4 & A5 so that all three are selected.
  6. Click Track Historic in cell L1.
  7. You can now watch the program go through each day calculating all of the data. All of this data will be on the HistData sheet.
  8. Go to the HistPivot sheet. It is actually a Pivot Table. It should look like this.
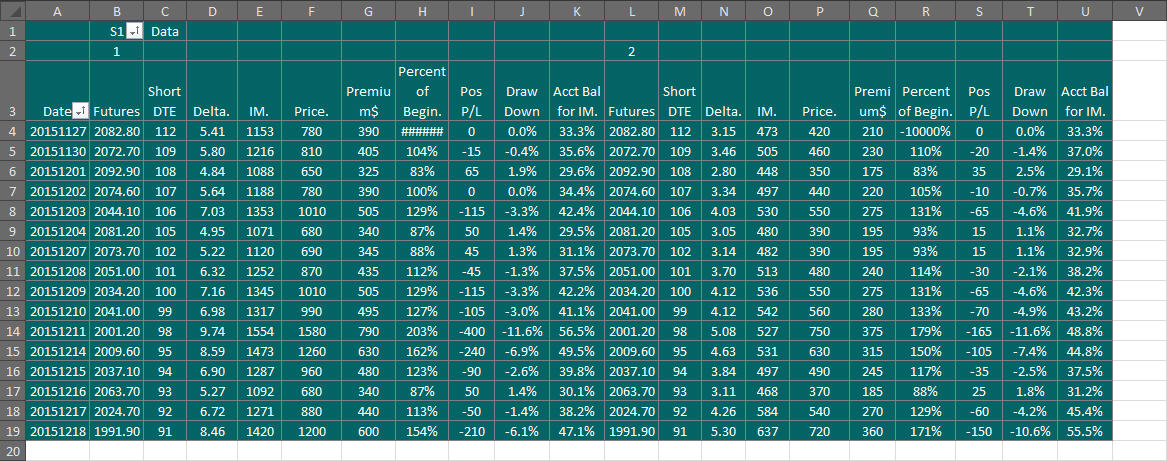

  9. Column A has the dates. Row 2 has the numbers you put in column S1 on the Tracker sheet. Columns B-K have the data for the option that has "1" in column S1 on the Tracker sheet. Columns L-U have the data for the spread that has "2" in column S1 on the Tracker sheet.

    The first 6 columns (B-G for number 1) for each S1 number have raw data. The next 4 columns (H-K for number 1) have calculated data. This calculated data is not quite correct if you are using the first date for the day prior to the day you are adding the position. That is why it is best to move it over to the ES sheet.
  10. To move this data to my ES sheet that shows some additional info you would copy the date column from HistPivot and paste it to the first column in each block on the ES sheet. You would then copy the raw data (for number 1 in this example cells C4 to G19) and paste it to cell B5 using Paste Values. Copy raw data in cells L4 to Q19 for number 2 to cell S5.
  11. Put the positions in the green cells in rows 2 & 3 columns C thru F on the ES sheet. The column F that has the number of positions is important so that the MROI can know how many contracts are in the position to correctly calculate fees.
  12. In cell A1 of the ES sheet you should enter your total round turn cost per contract.
  13. In cell B1 you should enter the multiplier for your IM. If you are using IMx3 then the number 3 should be in this cell.

the ES sheet should look like this
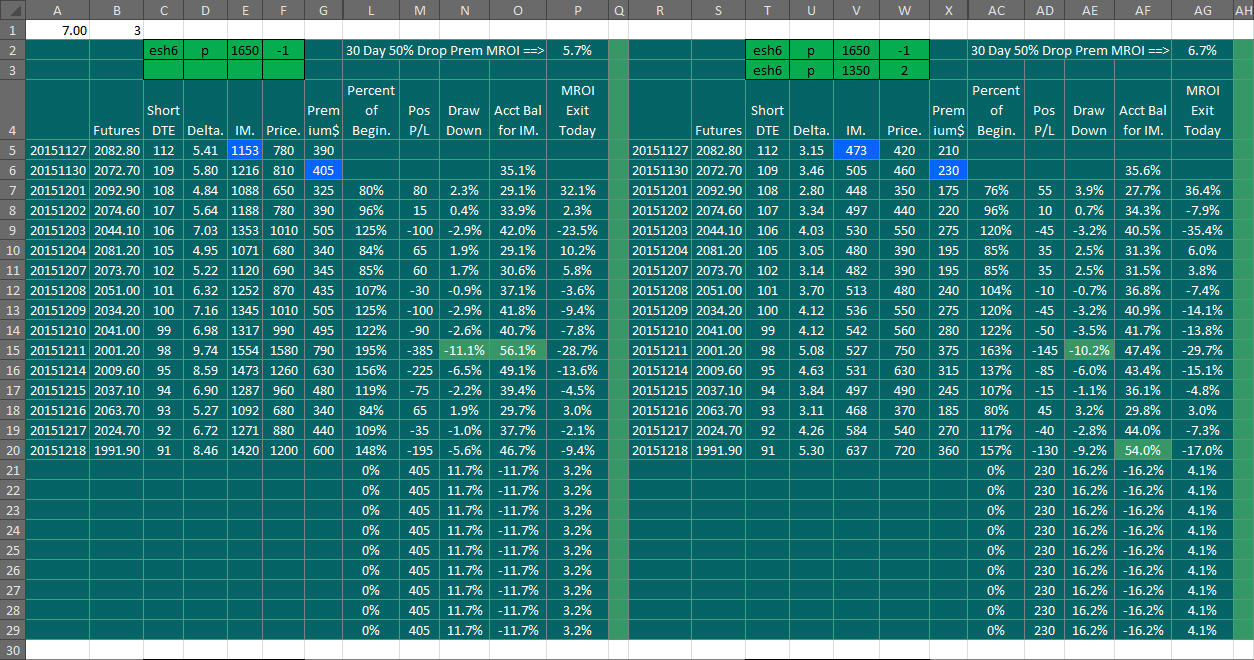


The blue cell E5 is the IM used for that block to do the calculations.

The blue cell G6 is the premium used for that block. This is the settlement. If you want you change this to what you actually entered a trade at you can do that here.

There are some hidden columns to make calculating easier. Normally you do not need to see what is there.

Column L or Percent of Beginning is current Premium in dollars divided by beginning premium.

Column M or Pos P/L is profit or loss in dollars since starting the position. It does not include costs.

Column N or Draw Down is Pos P/L divided by (beginning IM times the number in cell B1). A negative number means that the position has lost money since it was started. Positive is a profit. Again these are gross not net numbers. Costs aren't included. I have the lowest number in this column turn to a green background fill.

Column O or Acct Bal for IM is (Current IM + (Pos P/L*-1)) / (Beginning IM * number in cell B1). This percent, if this was the only position you had on and you fully invested in this position, would be how much of your account was now being used by IM. When this number goes over 110% you are on margin call. (You don't go on margin call until the maintenance margin is gone. Maintenance margin is 10% less than IM). I have the highest number in this column turn to a green background fill.

The blocks on the ES sheet can be copied and pasted to other areas of this sheet or to other sheets. If you need more lines per block then insert more lines and then copy down all cells from the last line of the block into the new added lines. This should keep the cell highlighting correct.

I hope this is clear.

@Ron and others: I seem to have some issues running the macros by clicking the buttons but can run the macros manually. Can someone help to give me the sequence. So far I can
- Run 'Track Selected' to populate the tracker sheet
- Run 'CleanHistData' which clears the HistData tab
- Run 'Historic_Track' which popoulates the HistData tab

Now I am stuck

What macros and in what sequence should i run to populate the HistPivot Tab

Would be much appreciated for input

Visit my NexusFi Trade Journal Reply With Quote
  #5237 (permalink)
 jokertrader 
NYC, NY
 
Experience: Intermediate
Platform: Sierra, TT
Broker: N/A
Trading: Spread Researcher and crypto degen
Posts: 654 since May 2013
Thanks Given: 545
Thanks Received: 360

Macros working now after going into Trust center and enabling macros

I did it before prob didnt save it and reopen maybe

Visit my NexusFi Trade Journal Reply With Quote
  #5238 (permalink)
 jokertrader 
NYC, NY
 
Experience: Intermediate
Platform: Sierra, TT
Broker: N/A
Trading: Spread Researcher and crypto degen
Posts: 654 since May 2013
Thanks Given: 545
Thanks Received: 360

How do i make it work for a diagonal

I can get lets say CLJ6 put spread to work but if i try

CLJ6 33 put -1
CLK6 31 put +1
It doesnt work

For the J6, futures and options month are the same
I do the same for K6 - am i doing something wrong?

any thanks to Dudetooth, Ron for this.. finally i have a backtesting solution (should have joined u guys a while ago.. oh well never too late)

Visit my NexusFi Trade Journal Reply With Quote
  #5239 (permalink)
k20a
TPE, TW
 
Posts: 49 since Jul 2014
Thanks Given: 11
Thanks Received: 47


Warren534 View Post
In my opinion and 30 years of trading experience, high volatility is actually the absolute best time to be selling options, as premiums are very inflated.

What is high volatility though ? People think volatility is high end of 2007, mid to high 20's VIX. Then came the 30's and it must be very high ? From 20's all the way upto 80's I'm sure people were selling "high volatility", and most got murdered. We're only in the 20's range at the moment. If Soros is correct in predicting a 08 crash, then we are actually at low end of volatility at the moment.

Reply With Quote
The following 2 users say Thank You to k20a for this post:
  #5240 (permalink)
 
PK 1's Avatar
 PK 1 
Kassel / Germany
 
Experience: None
Platform: MC
Broker: IB
Trading: CL/NG/ES
Posts: 72 since Aug 2011
Thanks Given: 128
Thanks Received: 62


Warren534 View Post
In my opinion and 30 years of trading experience, high volatility is actually the absolute best time to be selling options, as premiums are very inflated.

true, without question. Actually there's so much already written to this allover the web, so I just add a daily $VIX - Chart I'm using as a reference to find a good day to sell options. On the one hand there's an average volatility reflecting the market over longer time period. This can be 20's, 30's or whatever. On top of that there are vola-spikes. I defined some rules for me when to sell the vola giving me the chance to enter at a stage where vola is rather decreasing instead of increasing even more. But it happens, hence never all in the first occurence. By checking the vola in the neighborhood there are many Low-Vola-Days where I would not want to sell options on ES. Some occurences are marked.

Reply With Quote


Last Updated on July 28, 2023


© 2024 NexusFi™, s.a., All Rights Reserved.
Av Ricardo J. Alfaro, Century Tower, Panama City, Panama, Ph: +507 833-9432 (Panama and Intl), +1 888-312-3001 (USA and Canada)
All information is for educational use only and is not investment advice. There is a substantial risk of loss in trading commodity futures, stocks, options and foreign exchange products. Past performance is not indicative of future results.
About Us - Contact Us - Site Rules, Acceptable Use, and Terms and Conditions - Privacy Policy - Downloads - Top
no new posts