NexusFi: Find Your Edge


Home Menu


Coding Multi Time Frame (MTF) Indicators with NinjaTrader


Discussion in NinjaTrader

Updated
      Top Posters
    1. looks_one Fat Tails with 180 posts (562 thanks)
    2. looks_two Zondor with 19 posts (29 thanks)
    3. looks_3 madLyfe with 16 posts (10 thanks)
    4. looks_4 BankRobberNT with 14 posts (16 thanks)
      Best Posters
    1. looks_one gomi with 3.7 thanks per post
    2. looks_two Fat Tails with 3.1 thanks per post
    3. looks_3 Zondor with 1.5 thanks per post
    4. looks_4 BankRobberNT with 1.1 thanks per post
    1. trending_up 189,562 views
    2. thumb_up 743 thanks given
    3. group 87 followers
    1. forum 424 posts
    2. attach_file 166 attachments


Search this Thread

Coding Multi Time Frame (MTF) Indicators with NinjaTrader

  #101 (permalink)
 
Fat Tails's Avatar
 Fat Tails 
Berlin, Europe
Market Wizard
 
Experience: Advanced
Platform: NinjaTrader, MultiCharts
Broker: Interactive Brokers
Trading: Keyboard
Posts: 9,888 since Mar 2010
Thanks Given: 4,242
Thanks Received: 27,103


trendisyourfriend View Post
What is the difference between using a 5 x 5minutes and using a normal MACD with 12x5, 26x5, 9x5 periods ?

Below is a chart with two data series, a 3 min and a 5 min data series of ES. Compare thhe indicators in the three lower panels.

(a) Original 14-period DM/ADX calculated from a 15 min series

(b) 70-period DM/ADX calculated from a 3 min series

(c) Multi-timeframe 14-period ADX calculated from a 3 minute series

Would you say that (b) or (c) is a better match for (a)?

Attached Thumbnails
Click image for larger version

Name:	Comparison DM.jpg
Views:	304
Size:	124.7 KB
ID:	45955  
Started this thread Reply With Quote
Thanked by:

Can you help answer these questions
from other members on NexusFi?
ZombieSqueeze
Platforms and Indicators
MC PL editor upgrade
MultiCharts
Better Renko Gaps
The Elite Circle
Quant vue
Trading Reviews and Vendors
NexusFi Journal Challenge - May 2024
Feedback and Announcements
 
Best Threads (Most Thanked)
in the last 7 days on NexusFi
What is Markets Chat (markets.chat) real-time trading ro …
72 thanks
Spoo-nalysis ES e-mini futures S&P 500
55 thanks
Just another trading journal: PA, Wyckoff & Trends
27 thanks
Bigger Wins or Fewer Losses?
24 thanks
The Program
16 thanks
  #102 (permalink)
 
davidfa's Avatar
 davidfa 
Barcelona / Spain
 
Experience: Intermediate
Platform: NT
Broker: ZenFire
Trading: CL
Posts: 118 since Feb 2010
Thanks Given: 366
Thanks Received: 148


Fat Tails View Post
I have looked for a way to code "false" multi-timeframe indicators from a single bar series. This has both advantages and inconvenients compared to real multi- timeframe indicators.

Advantage: Only loading 1 bar series, faster loading and calculation, robustness.

I find the concept very interesting and I would implement it on the indicators I use within that scenario.
I do need faster loading, calculation and robustness
Would you share an indicator example that uses this technique you've implemented?

In the end, don't you feel like NT is lacking a public read collection access similar to workspaces(n).charts(i).indicators(j).values(k)?
Examples where needed:
- suppose we have a 5min chart with other ones where we want the 5min 20ema replicated. Would only be calculated once on the 5m chart and then accessed from other charts just to plot that value, not needing to recalculate it.
- or for Value Area and Poc computation avoided on more than one chart

I'd like if you could also point me out the instructions or thread where explains how to debug indicators one by one with VS2005 or similar so as to compare performances.

Thanks

Visit my NexusFi Trade Journal Reply With Quote
Thanked by:
  #103 (permalink)
 
Zondor's Avatar
 Zondor 
Portland Oregon, United States
 
Experience: Beginner
Platform: Ninjatrader®
Broker: CQG, Kinetick
Trading: Gameplay Klownbine® Trading of Globex
Posts: 1,333 since Jul 2009
Thanks Given: 1,246
Thanks Received: 2,731


Quoting 
In the end, don't you feel like NT is lacking a public read collection access similar to workspaces(n).charts(i).indicators(j).values(k)?
Examples where needed:
- suppose we have a 5min chart with other ones where we want the 5min 20ema replicated. Would only be calculated once on the 5m chart and then accessed from other charts just to plot that value, not needing to recalculate it.
- or for Value Area and Poc computation avoided on more than one chart


What a great idea! I wonder if there is a way to implement this now by some type of workaround. Maybe using a special namespace. Or calculating values outside of Ninjatrader and making them available from an outside file like a GomRecorder file, or a database.

Follow me on Twitter Visit my NexusFi Trade Journal Reply With Quote
Thanked by:
  #104 (permalink)
 
Fat Tails's Avatar
 Fat Tails 
Berlin, Europe
Market Wizard
 
Experience: Advanced
Platform: NinjaTrader, MultiCharts
Broker: Interactive Brokers
Trading: Keyboard
Posts: 9,888 since Mar 2010
Thanks Given: 4,242
Thanks Received: 27,103


davidfa View Post
I find the concept very interesting and I would implement it on the indicators I use within that scenario.
I do need faster loading, calculation and robustness
Would you share an indicator example that uses this technique you've implemented?

In the end, don't you feel like NT is lacking a public read collection access similar to workspaces(n).charts(i).indicators(j).values(k)?
Examples where needed:
- suppose we have a 5min chart with other ones where we want the 5min 20ema replicated. Would only be calculated once on the 5m chart and then accessed from other charts just to plot that value, not needing to recalculate it.
- or for Value Area and Poc computation avoided on more than one chart

I'd like if you could also point me out the instructions or thread where explains how to debug indicators one by one with VS2005 or similar so as to compare performances.

Thanks

Sorry I did not answer earlier, simply forgot it. The point is that the bar series which is calculated may use a different session template than the bar series shown on another chart, in this case, the other values cannot be used. Although your idea is great from a point of view of CPU performance, it would create additional interdependencies, which in the end may pose additional problems. So I am a bit sceptical. But then I do not have the profound knowledge of the internal architecture of NinjaTrader to really be able to appreciate your suggestion.

Started this thread Reply With Quote
Thanked by:
  #105 (permalink)
 
Fat Tails's Avatar
 Fat Tails 
Berlin, Europe
Market Wizard
 
Experience: Advanced
Platform: NinjaTrader, MultiCharts
Broker: Interactive Brokers
Trading: Keyboard
Posts: 9,888 since Mar 2010
Thanks Given: 4,242
Thanks Received: 27,103

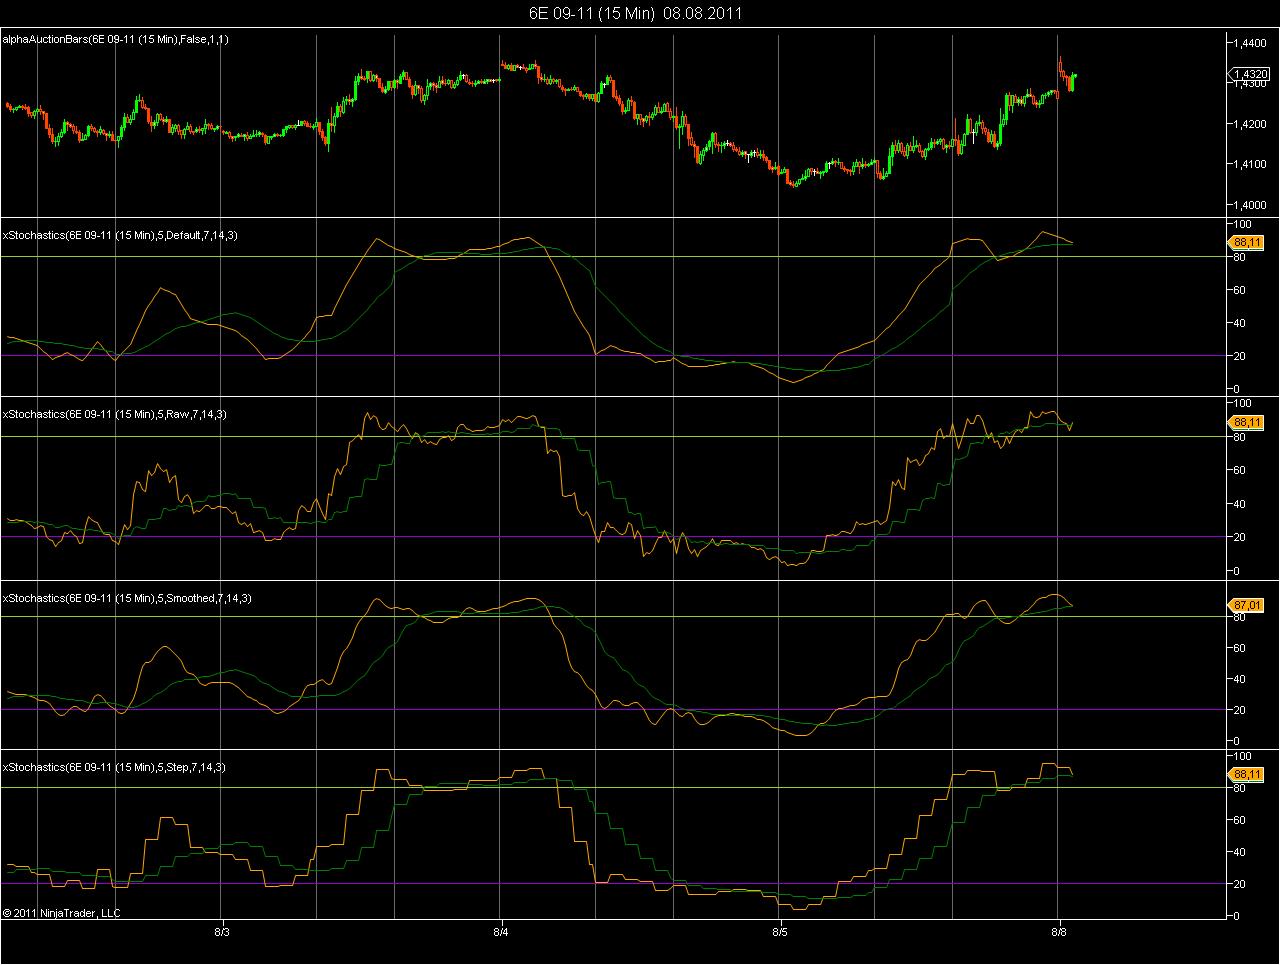
Here is another experiment with a multi-timeframe Stochastics indicator.

The indicator creates higher time-frame bars by using the primary bar series, no loading of a secondary bar series is necessary. The chart again shows various approaches

Panel 2: Exact replication of the higher time-frame indicator
Panel 3: Raw Stochastics calculated from a rolling higher time-frame
Panel 4: Smoothed Raw Stochastics
Panel 5: Step function, as shown by conventional MTF indicators

This is still work in progress. The indicators in panel 2 and panel 4 are useful as higher timeframe stochastics. The panel 4 indicator (smoothed raw rolling) does not repaint, the panel 2 indicator repaints within the unstable period of the higher timeframe, so it should not be used for running strategies.


Started this thread Reply With Quote
Thanked by:
  #106 (permalink)
 
Fat Tails's Avatar
 Fat Tails 
Berlin, Europe
Market Wizard
 
Experience: Advanced
Platform: NinjaTrader, MultiCharts
Broker: Interactive Brokers
Trading: Keyboard
Posts: 9,888 since Mar 2010
Thanks Given: 4,242
Thanks Received: 27,103

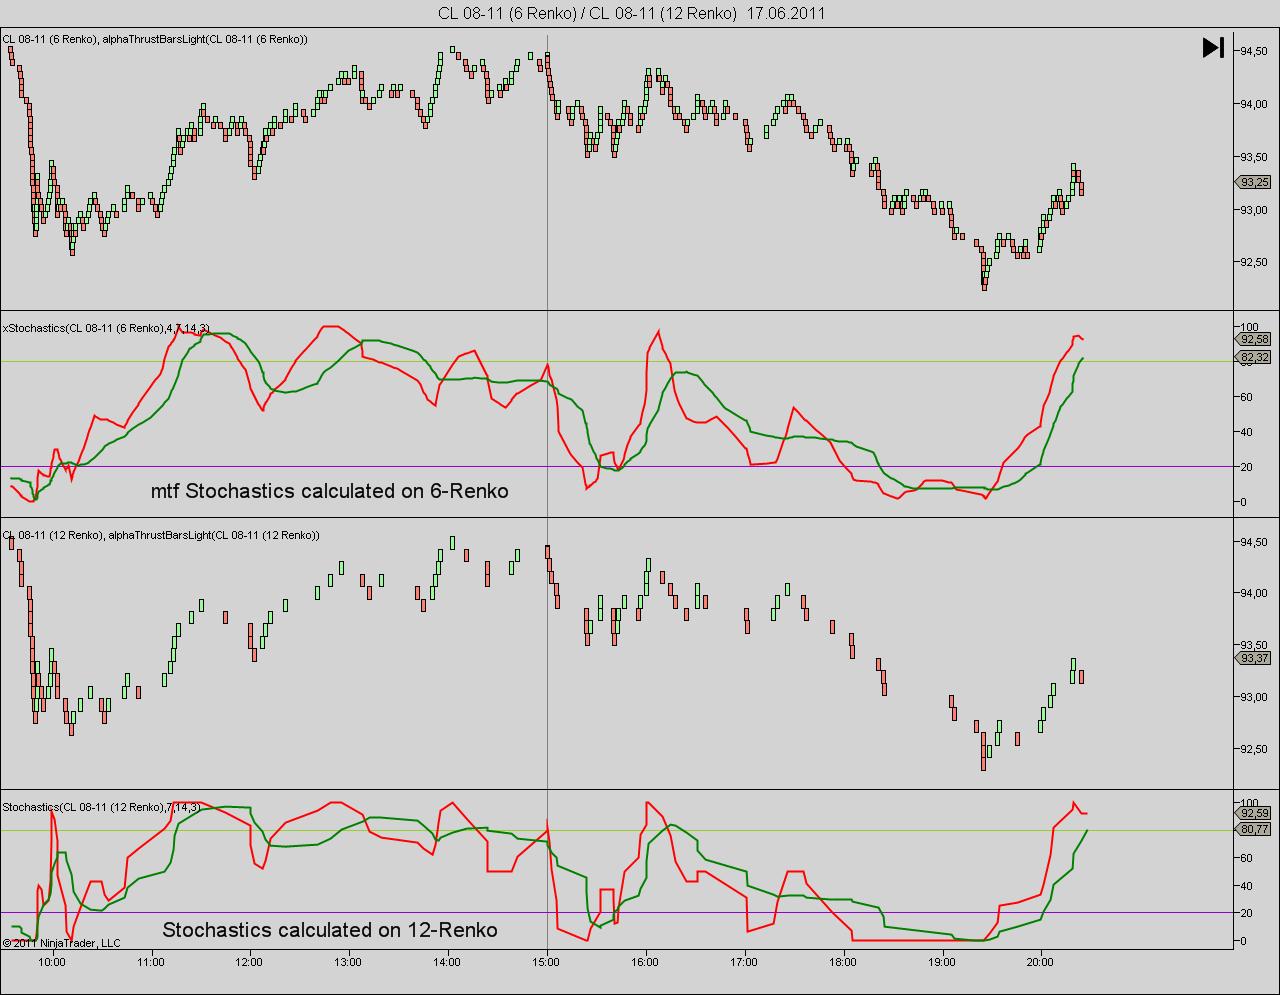
For Range and Renko Bars, there is a difficulty to calculate the higher timeframe bars from the primary bars, which can be easily understood. Let us take the example of a time frame factor 5:

a 5-minute bar -> can be built from five 1-minute bars
a 5000-volume bar -> can be built from five 1000-volume bars
a 500-tick bar -> can be built from five 100-tick bars

a 5 range bar -> can not be built from five 1-range bars

It is known that in general volatility is proportianal to the square root of time. Using this relation ship you can build
a 5 range bar by regrouping twenty five 1-range bars. This does not give an exact replication of the higher time frame but a reasonable approximation. The same reasoning applies to Renko bars. The result is shown below.


Started this thread Reply With Quote
  #107 (permalink)
 ceramictilepro 
Roseville CA
 
Experience: Advanced
Platform: N7
Broker: Amp Futures/CQG
Trading: ES
Posts: 124 since Jun 2009
Thanks Given: 32
Thanks Received: 21

I keep getting an error when trying to import script for the VisualSMAX2.

also attached are all my files that have been imported successfully without any errors.

I am currently using v 7.0.1.0007

thanks for any ideas

Attached Thumbnails
Click image for larger version

Name:	VisualSMAX2zip_error.jpg
Views:	226
Size:	23.1 KB
ID:	47593   Click image for larger version

Name:	imported_script.jpg
Views:	204
Size:	16.0 KB
ID:	47594  
Reply With Quote
  #108 (permalink)
 
Fat Tails's Avatar
 Fat Tails 
Berlin, Europe
Market Wizard
 
Experience: Advanced
Platform: NinjaTrader, MultiCharts
Broker: Interactive Brokers
Trading: Keyboard
Posts: 9,888 since Mar 2010
Thanks Given: 4,242
Thanks Received: 27,103


ceramictilepro View Post
I keep getting an error when trying to import script for the VisualSMAX2.

also attached are all my files that have been imported successfully without any errors.

I am currently using v 7.0.1.0007

thanks for any ideas

The VisualSMAX2 was an experimental pre-version. Please uninstall any VisualSMA files via File -> Utilities -> Remove NinjaScript Assemblies first. Then import the latest VisualSMA from the Download section of this forum.

Started this thread Reply With Quote
Thanked by:
  #109 (permalink)
 
Fu510n's Avatar
 Fu510n 
Suffield, CT
 
Experience: Advanced
Platform: MC, TS, Python, Rust
Broker: IB, IQFeed, TS, Kraken
Trading: ES, NQ, RTY, YM, CL, RB, 6E
Frequency: Several times daily
Duration: Seconds
Posts: 144 since Oct 2009
Thanks Given: 902
Thanks Received: 143

Fat Tails,

Just curious (given that Perry's new system now includes VisualSMAX) whether you've given any thought to porting any of your MTF indicators to MC7? I bit the bullet and decided to go the MultiCharts route vs. Ninja (i.e. bought a lifetime license but could only afford one or the other), so I've been converting indicators as necessary given that futures.io (formerly BMT) is predominantly NT-centric (though MC, Sierra and others are increasing in number).

Alas these are protected (otherwise I wouldn't be asking ).

Thanks,
-Guy

Follow me on Twitter Reply With Quote
  #110 (permalink)
 
Fat Tails's Avatar
 Fat Tails 
Berlin, Europe
Market Wizard
 
Experience: Advanced
Platform: NinjaTrader, MultiCharts
Broker: Interactive Brokers
Trading: Keyboard
Posts: 9,888 since Mar 2010
Thanks Given: 4,242
Thanks Received: 27,103


Fu510n View Post
Fat Tails,

Just curious (given that Perry's new system now includes VisualSMAX) whether you've given any thought to porting any of your MTF indicators to MC7? I bit the bullet and decided to go the MultiCharts route vs. Ninja (i.e. bought a lifetime license but could only afford one or the other), so I've been converting indicators as necessary given that futures.io (formerly BMT) is predominantly NT-centric (though MC, Sierra and others are increasing in number).

Alas these are protected (otherwise I wouldn't be asking ).

Thanks,
-Guy

The code is specificly adapted to the architecture of NinjaTrader and will possibly not run on MultiCharts. Some of the key points are the session management and the way NinjaTrader handles non-equidistant spacing. I think that the logic of this needs to modified for MultiCharts, so I cannot be of a great help.

Started this thread Reply With Quote


Last Updated on April 19, 2022


© 2024 NexusFi™, s.a., All Rights Reserved.
Av Ricardo J. Alfaro, Century Tower, Panama City, Panama, Ph: +507 833-9432 (Panama and Intl), +1 888-312-3001 (USA and Canada)
All information is for educational use only and is not investment advice. There is a substantial risk of loss in trading commodity futures, stocks, options and foreign exchange products. Past performance is not indicative of future results.
About Us - Contact Us - Site Rules, Acceptable Use, and Terms and Conditions - Privacy Policy - Downloads - Top
no new posts