Welcome to NexusFi: the best trading community on the planet, with over 150,000 members Sign Up Now for Free
Genuine reviews from real traders, not fake reviews from stealth vendors
Quality education from leading professional traders
We are a friendly, helpful, and positive community
We do not tolerate rude behavior, trolling, or vendors advertising in posts
We are here to help, just let us know what you need
You'll need to register in order to view the content of the threads and start contributing to our community. It's free for basic access, or support us by becoming an Elite Member -- see if you qualify for a discount below.
-- Big Mike, Site Administrator
(If you already have an account, login at the top of the page)
@Zondor: I saw your version of the Awesome Oscillator.
In my opinion it is a completely different indicator and has little to do with the original Awesome Oscillator.
I have compared the indicator with the Awesome Oscillator as it was created by Bill Williams. I do not think it is a good idea to replace various parts of the code and still call it Awesome Oscillator. It shows a completely different behavior.
Chart attached below with Awesome Oscillator and new Update. Hope you do not mind my comment.
I don't mind at all, but please don't report me to Bill Williams!
Now the question is whether this in-need-of-a-new-name concoction is of any practical value. With actual median values and a more responsive MA, I considered that this version might be more faithful to the original intended concept. Or might not!
Actually your indicator is quite different from the Awesome Oscillator.
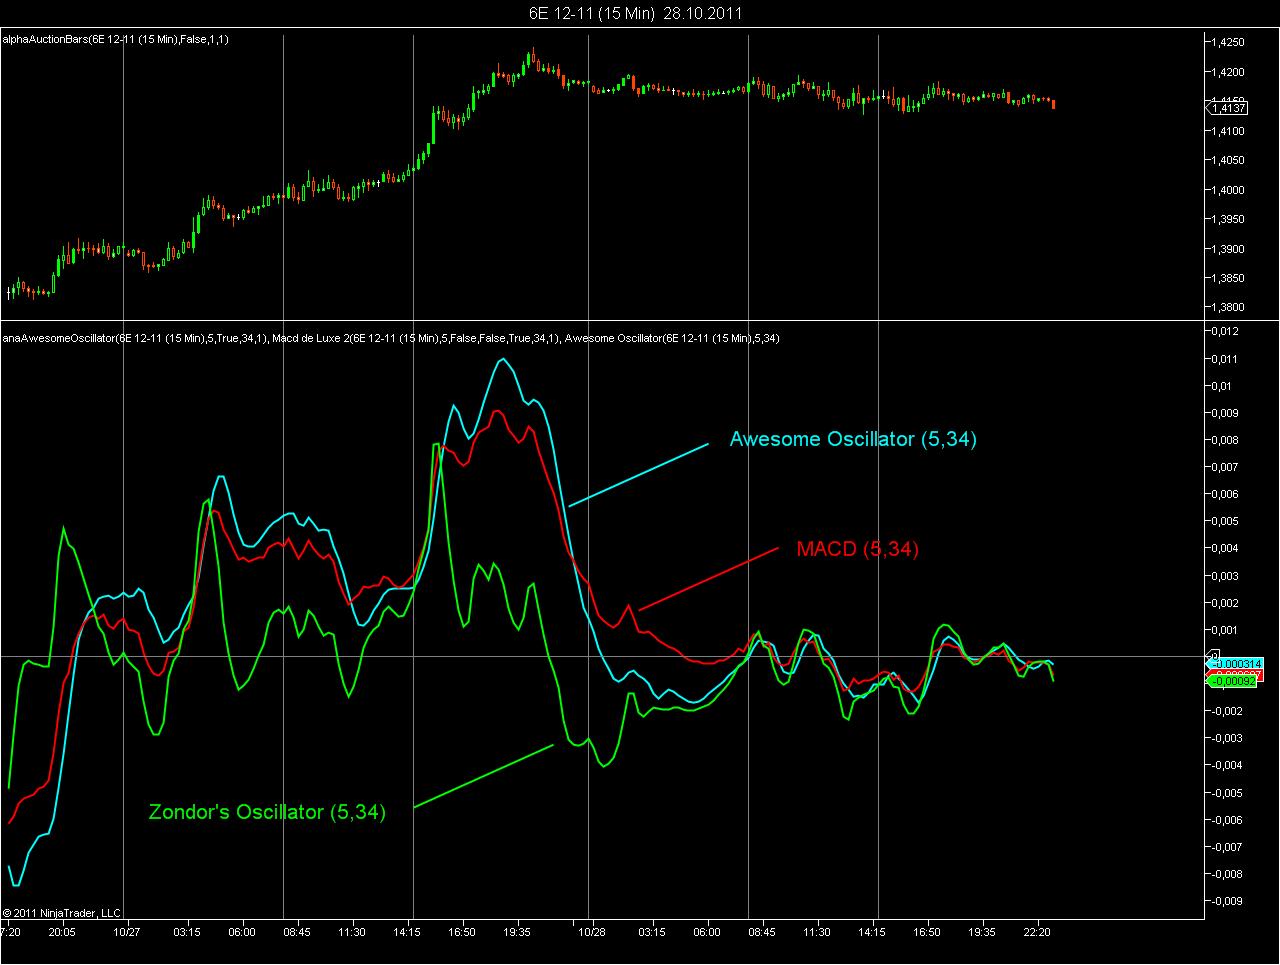
-> The raw MACD is the difference between a fast and a slow EMA.
-> The Awesome Oscillator is the difference between a fast and a slow SMA.
-> Zondor's oscillator is the difference between a fast and a slow LLMA.
If you look at the chart below, you will find that the MACD (red) and the Awesome Oscillator (blue) are close relatives, but that Zondor's Oscillator (green) is quite different. All indicators use the same settings, that is a period of 5 for the fast and a period of 34 for the slow moving average.
There are some changes to my recently posted mutant Awesome Oscillator. It now uses the statistical median of each bar. I believe that the calculation method is correct (midpoint member of a sorted ArrayList), but I needed to make a few small "sledge hammer" tweaks to the code to get it to plot.
Another find from the Ninjatrader Forums, attributed to the legendary Bill Williams but the version I found there was coded so poorly as to be useless.
Changed the plot to a multi-color line.
Added user selection option for MA periods. Defaults …
How it differs from the starting point version on the Ninja Forum:
Changed the plot to a multi-color line.
Added user selection option for MA periods. Defaults are 9/12, original was 5/34.
Added the choice of using the actual statistical median, computed on a bar by bar basis, or the Ninjatrader median which is just the average of the High and Low.
I don't know if I would have called it Awesome. Awful, maybe?
If you add the Awesome Oscillator to a chart, you will notice that the oscillator line is deactivated. This means that no values are written to the OscillatorLine plot. In this case NinjaTrader set the close value to the DataSeries. The close is always > 0, as there are no negative prices. But if you check for a value via "anaAwesomeOscillator.OscillatorLine.ContainsValue(0)", this should return false, as no value has been set to the plot!
You have two choices that will work
(1) activate the line via anaAwesomeOscillator(5, true, 34, 5).OscillatorLine[0]
(2) or use the plot that is not being disabled anaAwesomeOscillator(5, false, 34, 5).Oscillator[0]
Only if you disable the line plot and then try to access the disabled line, it cannot work.