|
Oslo Norway
Posts: 439 since Aug 2018
Thanks Given: 393
Thanks Received: 532
|
Hi all,
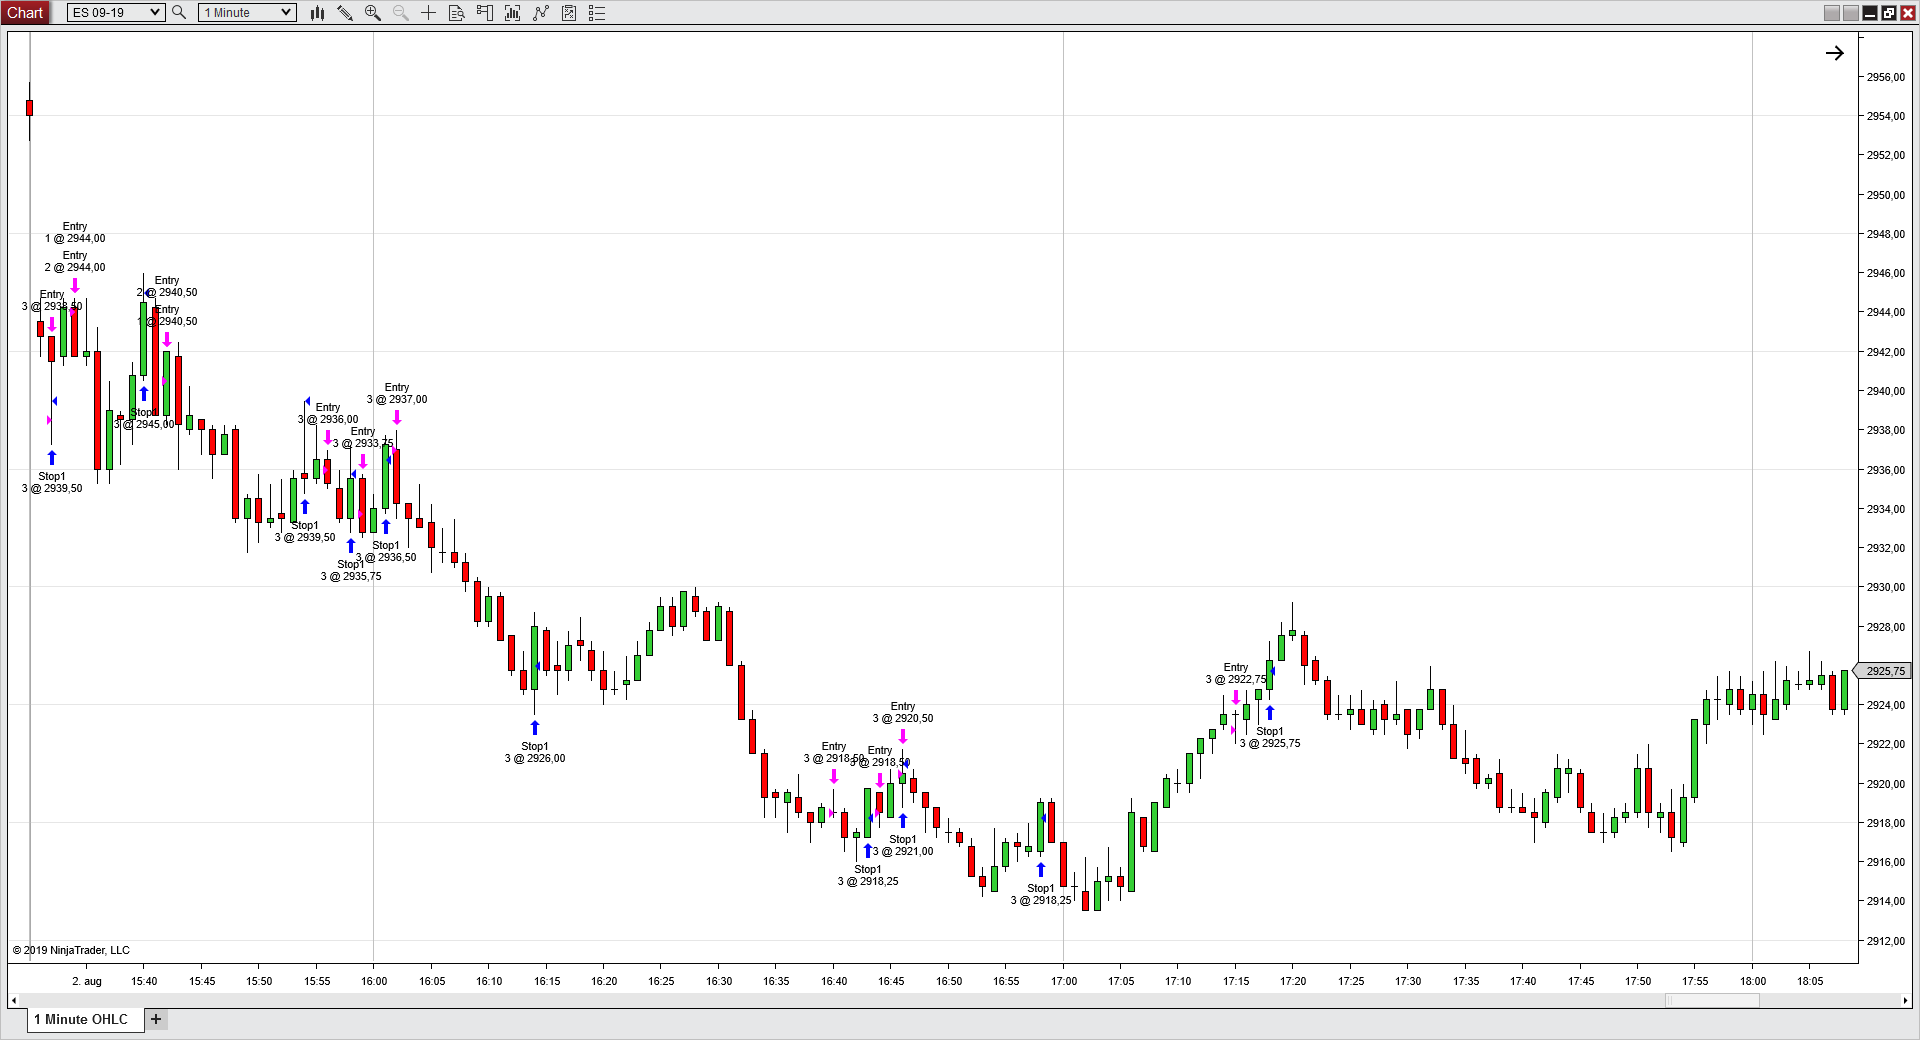
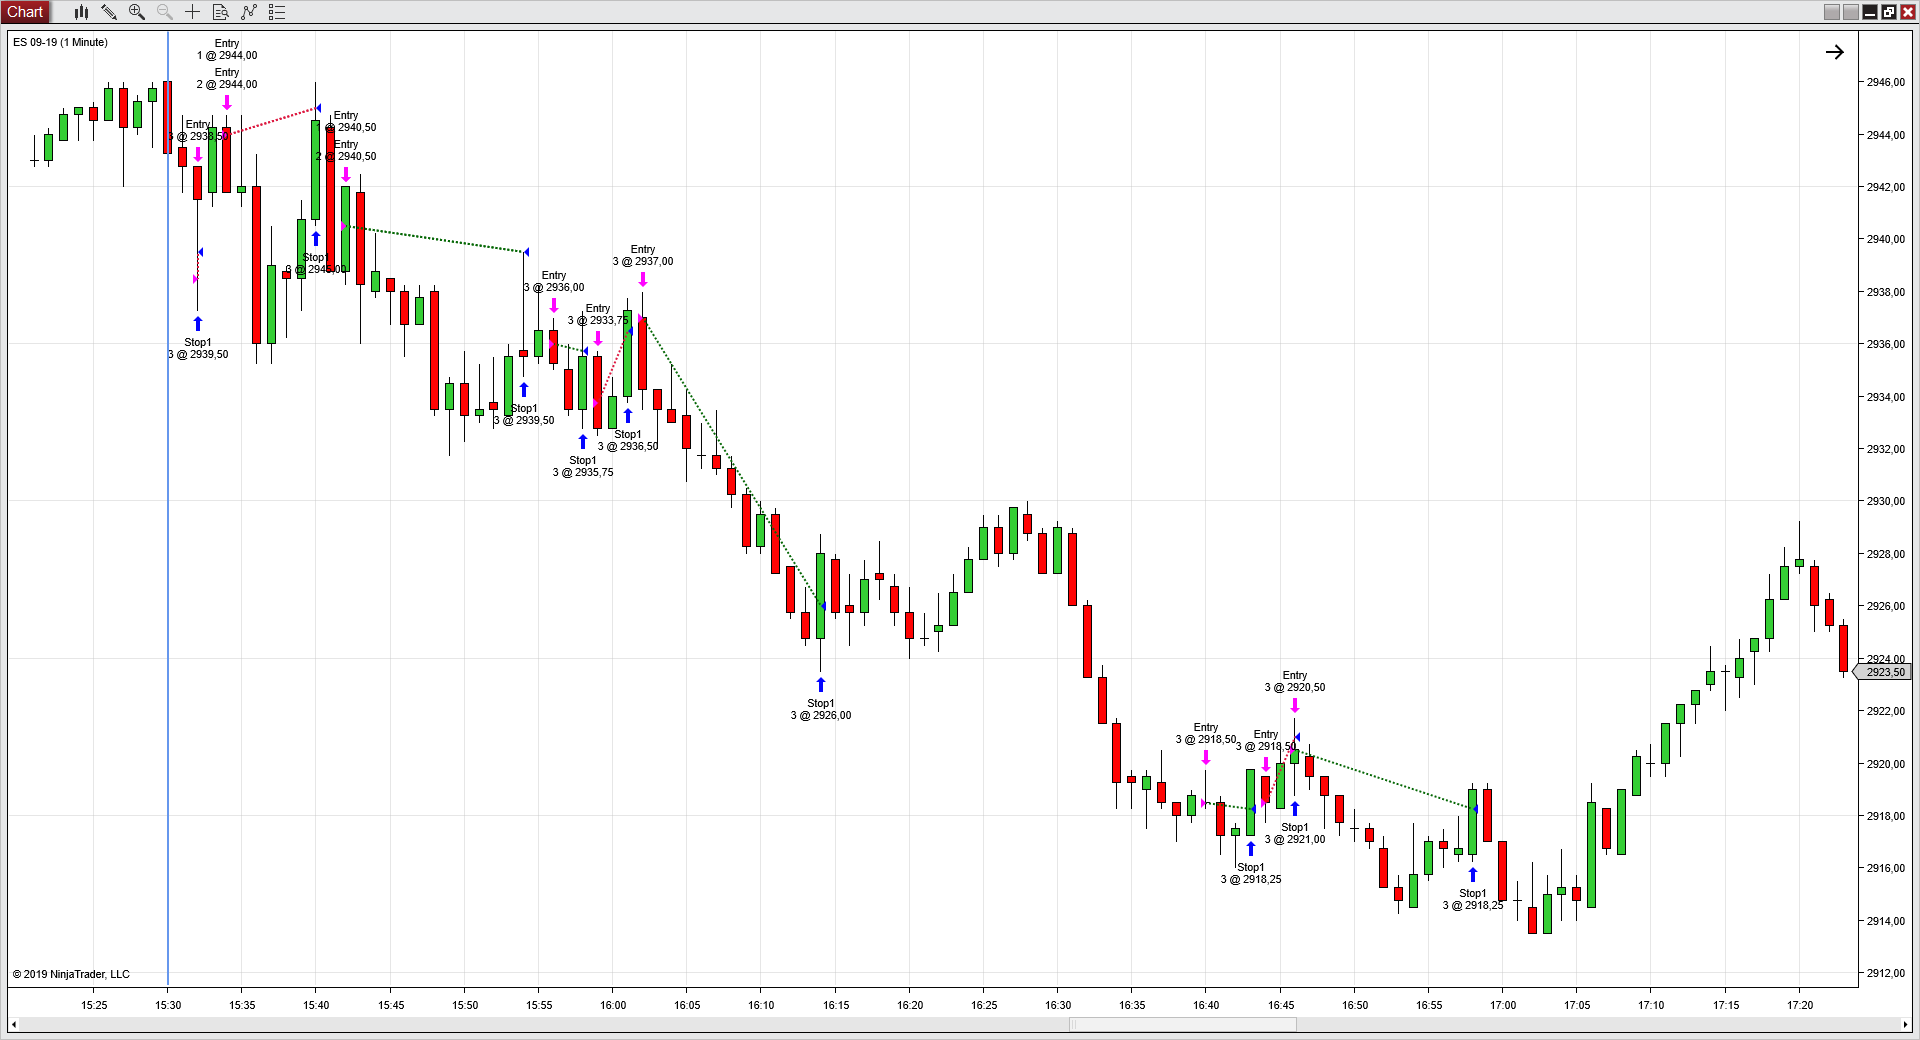
Related to the post I just created is also visualization of trades in NT. Here's yesterday for me.
To me, it seems a bit messy. On days where my trade frequency is low, it can be OKAY. But on days like this (and I even quit early for the day) it gets a bit ugly.
Are there any remedies for this? How does NT compare with other software on this?
I spend quite a time already logging the market and checking other stuff. Ideally, I'd do the same for my trades. But unless I can get more efficient doing so, I'm not sure I can justify spending the time doing it.
Blash (Ron) adviced me to open a chart of trades from the Trade Performance -> Trades window. It IS an improvement, but still messy on days with a high trade frequency.
Thanks in advance for sharing your thoughts. 
Howard
|


