NexusFi: Find Your Edge


Home Menu


Comparing Volatility


Discussion in NinjaTrader

Updated
      Top Posters
    1. looks_one tpredictor with 3 posts (1 thanks)
    2. looks_two Fat Tails with 3 posts (7 thanks)
    3. looks_3 ycomp with 3 posts (0 thanks)
    4. looks_4 iantg with 2 posts (1 thanks)
      Best Posters
    1. looks_one Fat Tails with 2.3 thanks per post
    2. looks_two Silvester17 with 2 thanks per post
    3. looks_3 iantg with 0.5 thanks per post
    4. looks_4 tpredictor with 0.3 thanks per post
    1. trending_up 4,878 views
    2. thumb_up 12 thanks given
    3. group 10 followers
    1. forum 13 posts
    2. attach_file 2 attachments


Search this Thread

Comparing Volatility

  #11 (permalink)
 flamboyant 
Cancun
 
Experience: None
Platform: Sierra Chart, MarketDelta
Trading: CL
Posts: 49 since Apr 2018
Thanks Given: 29
Thanks Received: 29


Fat Tails View Post
There is a statistical definition of volatility which is typically annualized.

To obtain the historical daily volatility you would calculate the standard deviation on daily logarithmic returns over a lookback period of N days and then divide the standard deviation by the square root SQRT(N). The interesting observation here is that volatility is approximately proportional to the square root of time.

For intraday data the definition above is more or less useless, and volatility is typically measured via

- the average range
- the average true range (see Welles Wilder's "New Concepts in Technical Trading Systems")
- the standard deviation

With these indicators volatility can only be correctly measured on time based charts. If you try to measure volatility by applying a range or true range indicator to a range or renko chart, you won't get any new information. Tick charts and volume charts are somewhere between time based and range or renko charts.

Nota: The original average true range (ATR) developed by Welles Wilder uses a Wilder moving average for smoothing. This is an exponential moving average with a smoothing constant of 1/N, where N is the lookback period. In other software packages you will also find other formulas for the average true range. Common variations are an arithmetic average and an exponential moving average that uses the smoothing constant 2/(N+1).

The average true range measures intra-bar volatility. It is only dependent on the size of all bars and the size of any gaps within the lookback period. Otherwise it shows the same result for a trending price action and a range bound price action. The same applies to the average range, which is similar to the average true range, but does not take into account any gaps.

The standard deviation only measures the dispersion the data points used for the calculation. It is not dependent on the size of the bars, but entirely relies on the deviation of the selected input series from its arithmetic mean. Think of the average range, ATR and standard deviation as follows

average range, ATR -> measure intra-bar volatility (volatility inside the price bars, ATR including the gaps)
standard deviation -> measures inter-bar volatility (for example volatility of the bar closes)


Displaying volatility:

If you wish to know, whether the current volatility is high or low, you may simply use the absolute readings of the average range (apply a 
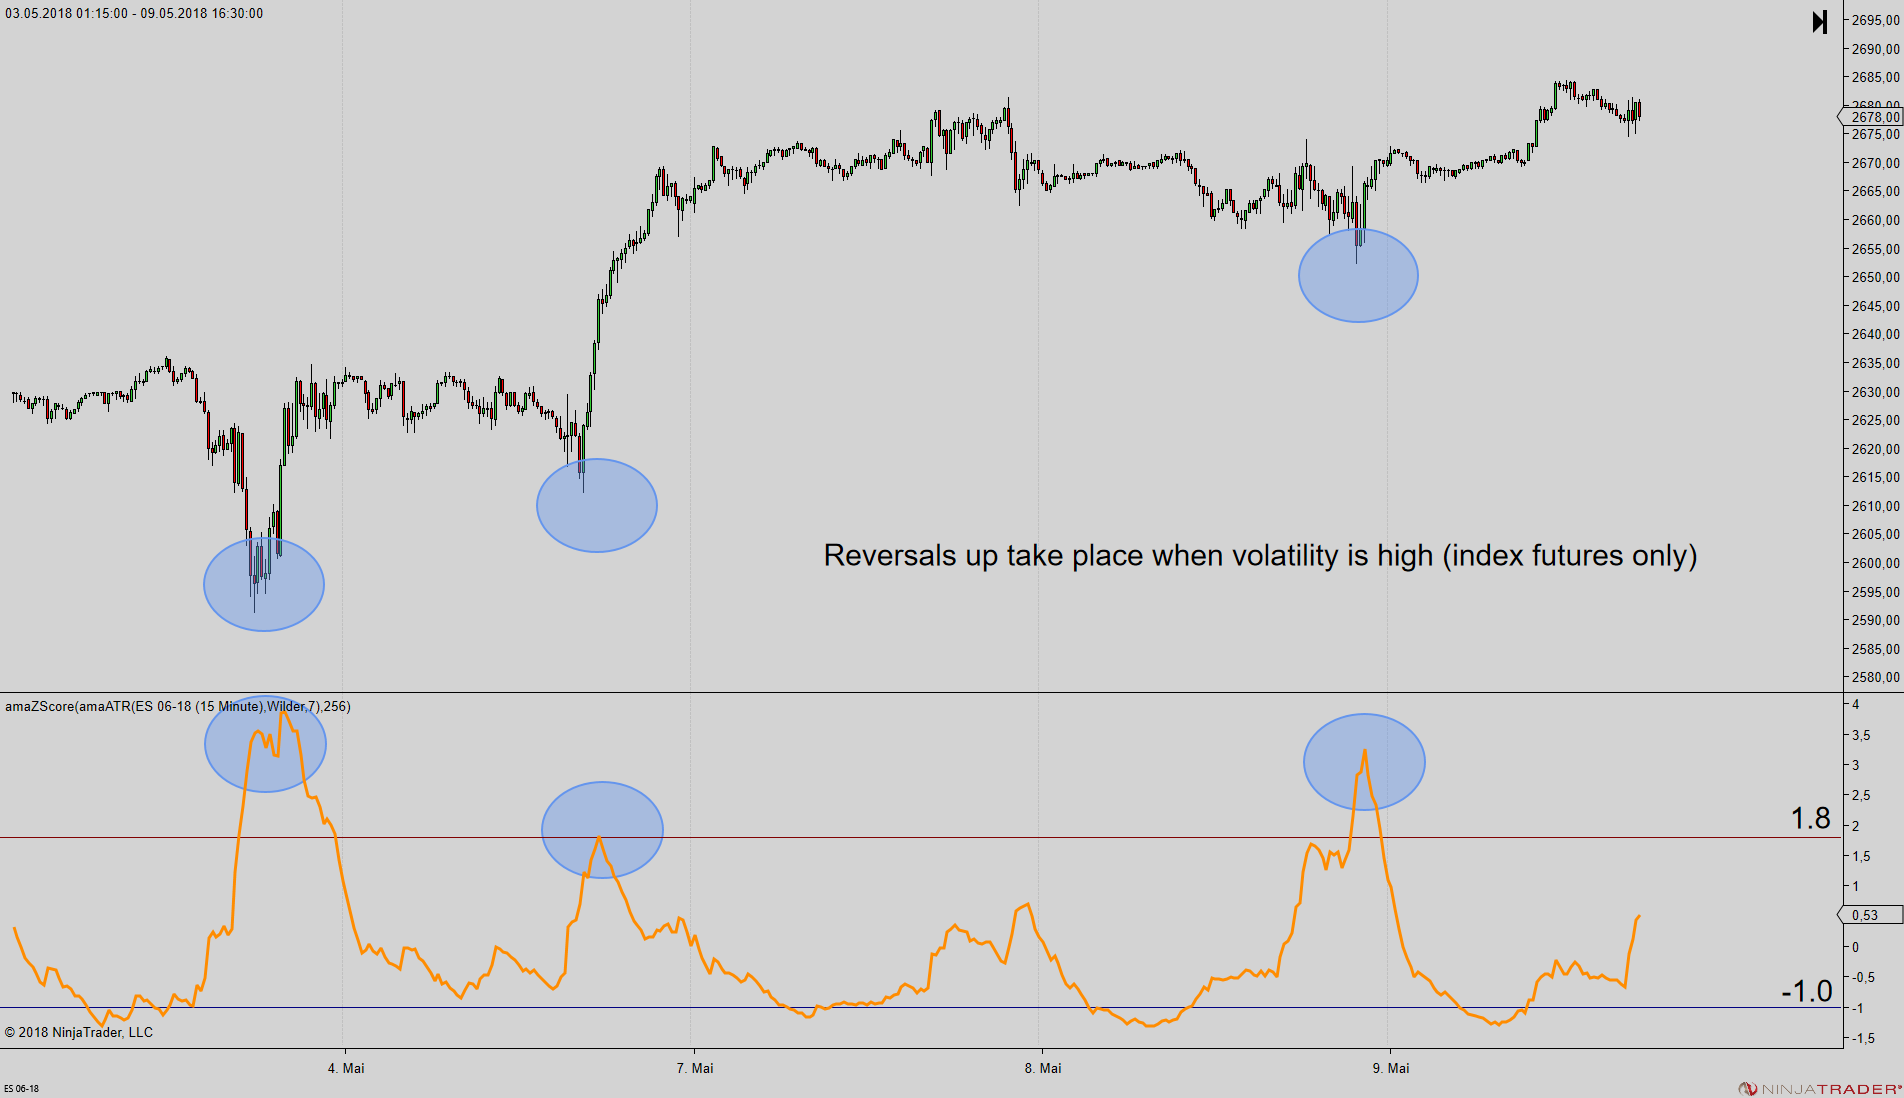
SMA to the range) or the average true range (ATR). Applying a z-score to the ATR is feasible, but has some limitations. Normally, a z-score makes only sense, if the underlying data points are more or less symmetrically distrbuted around the mean. This is not the case for the ATR, as it may rise ten fold, but not decline further than zero. Accordingly, if you apply the z-score to the ATR, it will never reach the lower threshold of 2 standard deviations, but only helps to identify the volatility peaks, when passing above the second upper deviation.

For stocks and index futures peak volatility is often linked to fear and is followed by upside reversals, so you may use this indicator to detect the temporary sell-offs (chart attached).


@Fat Tails

Where do i get amaATR?

Reply With Quote

Can you help answer these questions
from other members on NexusFi?
REcommedations for programming help
Sierra Chart
Cheap historycal L1 data for stocks
Stocks and ETFs
MC PL editor upgrade
MultiCharts
Trade idea based off three indicators.
Traders Hideout
ZombieSqueeze
Platforms and Indicators
 
  #12 (permalink)
 
Fat Tails's Avatar
 Fat Tails 
Berlin, Europe
Market Wizard
 
Experience: Advanced
Platform: NinjaTrader, MultiCharts
Broker: Interactive Brokers
Trading: Keyboard
Posts: 9,888 since Mar 2010
Thanks Given: 4,242
Thanks Received: 27,103


flamboyant View Post
@Fat Tails

Where do i get amaATR?

The main differences between amaATR and the default indicator ATR that ships with NinjaTrader are:

- amaATR may also be applied to input series other than price
- it comes with different options to calculate the average of the true range (SMA similar to TradeStation, EMA or Wilder's average as NinjaTrader)

amaATR is available in the LizardIndicators Library but is also part of the MultipleKeltnerChannel which can be found in the download section of this forum:


Reply With Quote
Thanked by:
  #13 (permalink)
Ozquant
Brisbane Queensland Australia
 
Posts: 220 since Aug 2017
Thanks Given: 167
Thanks Received: 380


I have a couple different versions of ATR i use for various functions be it screener or a filter for an algo

The basic one is just ATR expressed as a % which is great for screeners

//parameters
// p = 14

ATRP = (averagetruerange[p](close)/close)*100

RETURN ATRP as "Average True Range Percent"


The other i use a SQRT function to take the volatility out of ATR ( yeah sounds like oxymoron ) and only use relative ATR over X period so outliers of extreme ATR dont make relative changes in recent ATR obsolute for medium term / short term algos , not sure ive made this as clear as it could be


//parameters
// p = 10
//a = 10

ATR = (averagetruerange[p](close)/close)*100

ATRSQ = SQRT (ATR)


x = HIGHEST[a](HIGH[1])
y = LOWEST[a](LOW[1])
z=x-y
w=z*100/x


j = w/ATRSQ

RETURN j as " newshit "


One other i have used belongs to someone else but this is a pretty handy 0 - 100 atr score and has uses in algos for me

ATRPctRkLookback = b
ATRperiod = a

rnkCount = 0

ATR = averagetruerange[ATRperiod](close)

FOR i = 1 TO ATRPctRkLookback DO
IF ATR > ATR[i] THEN
rnkCount = rnkCount + 1
endif
NEXT

ATRPctRank = 100 * rnkCount / ATRPctRkLookback

RETURN ATRPctRank


These are codes in PRT language but i am sure most into this will have no trouble adapting

Reply With Quote
  #14 (permalink)
ants222222
new zealand
 
Posts: 6 since Aug 2017
Thanks Given: 0
Thanks Received: 2

Ozquant, can I ask where do you get the data from for SPI futures for backtesting? Your platform or elsewhere?
Thanks

Reply With Quote
Thanked by:


Last Updated on October 21, 2018


© 2024 NexusFi™, s.a., All Rights Reserved.
Av Ricardo J. Alfaro, Century Tower, Panama City, Panama, Ph: +507 833-9432 (Panama and Intl), +1 888-312-3001 (USA and Canada)
All information is for educational use only and is not investment advice. There is a substantial risk of loss in trading commodity futures, stocks, options and foreign exchange products. Past performance is not indicative of future results.
About Us - Contact Us - Site Rules, Acceptable Use, and Terms and Conditions - Privacy Policy - Downloads - Top
no new posts