|
Berlin, Europe
Market Wizard
Experience: Advanced
Platform: NinjaTrader, MultiCharts
Broker: Interactive Brokers
Trading: Keyboard
Posts: 9,888 since Mar 2010
Thanks Given: 4,242
Thanks Received: 27,103
|
Easiest way:
Make sure that you use a proper session template with a single session per day.
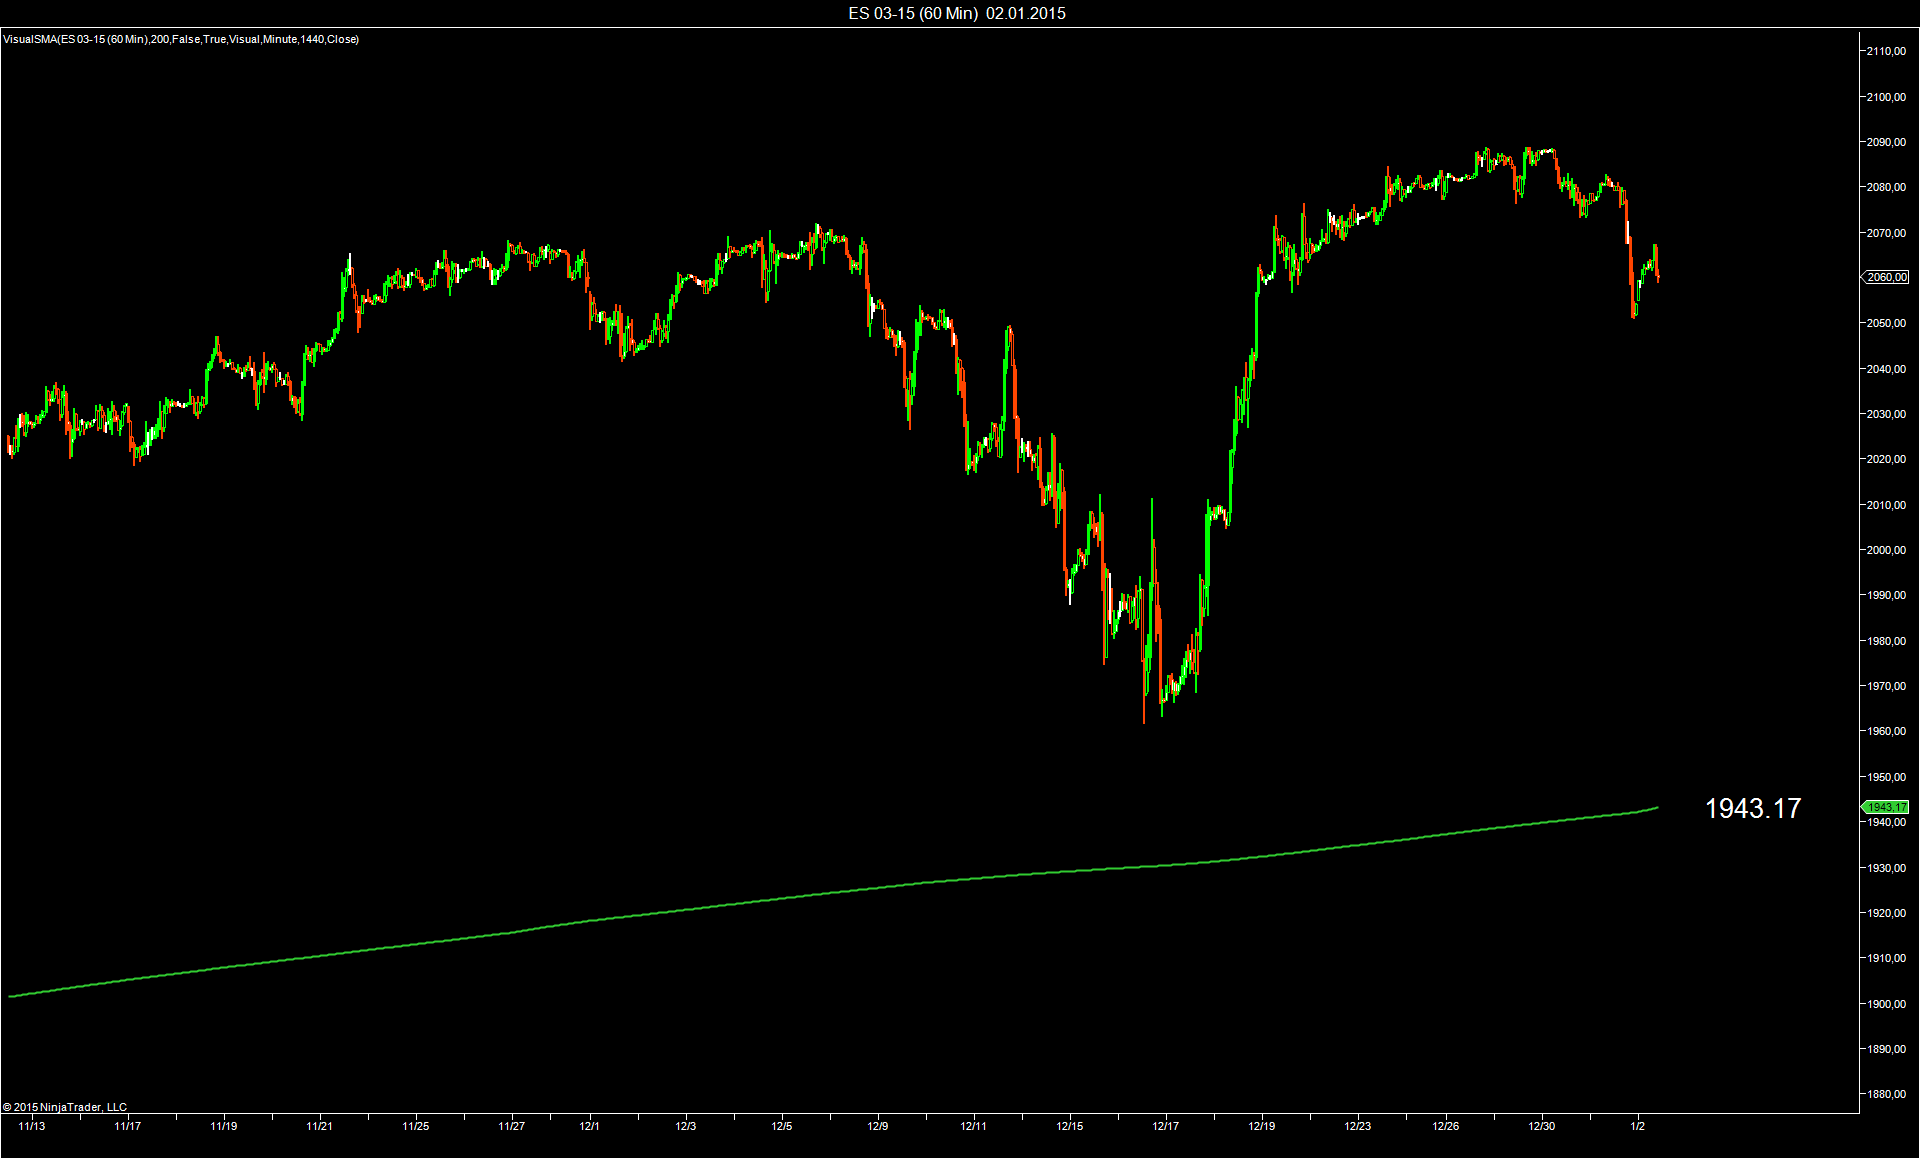
Then add the VisualSMA, set the "Bar Period" to 1440 and the "Period" to 200.
VisualSMA plotting a daily SMA(200): The SMA is calculated from the closing price (full session) of the last 200 business days for which the exchange was open.
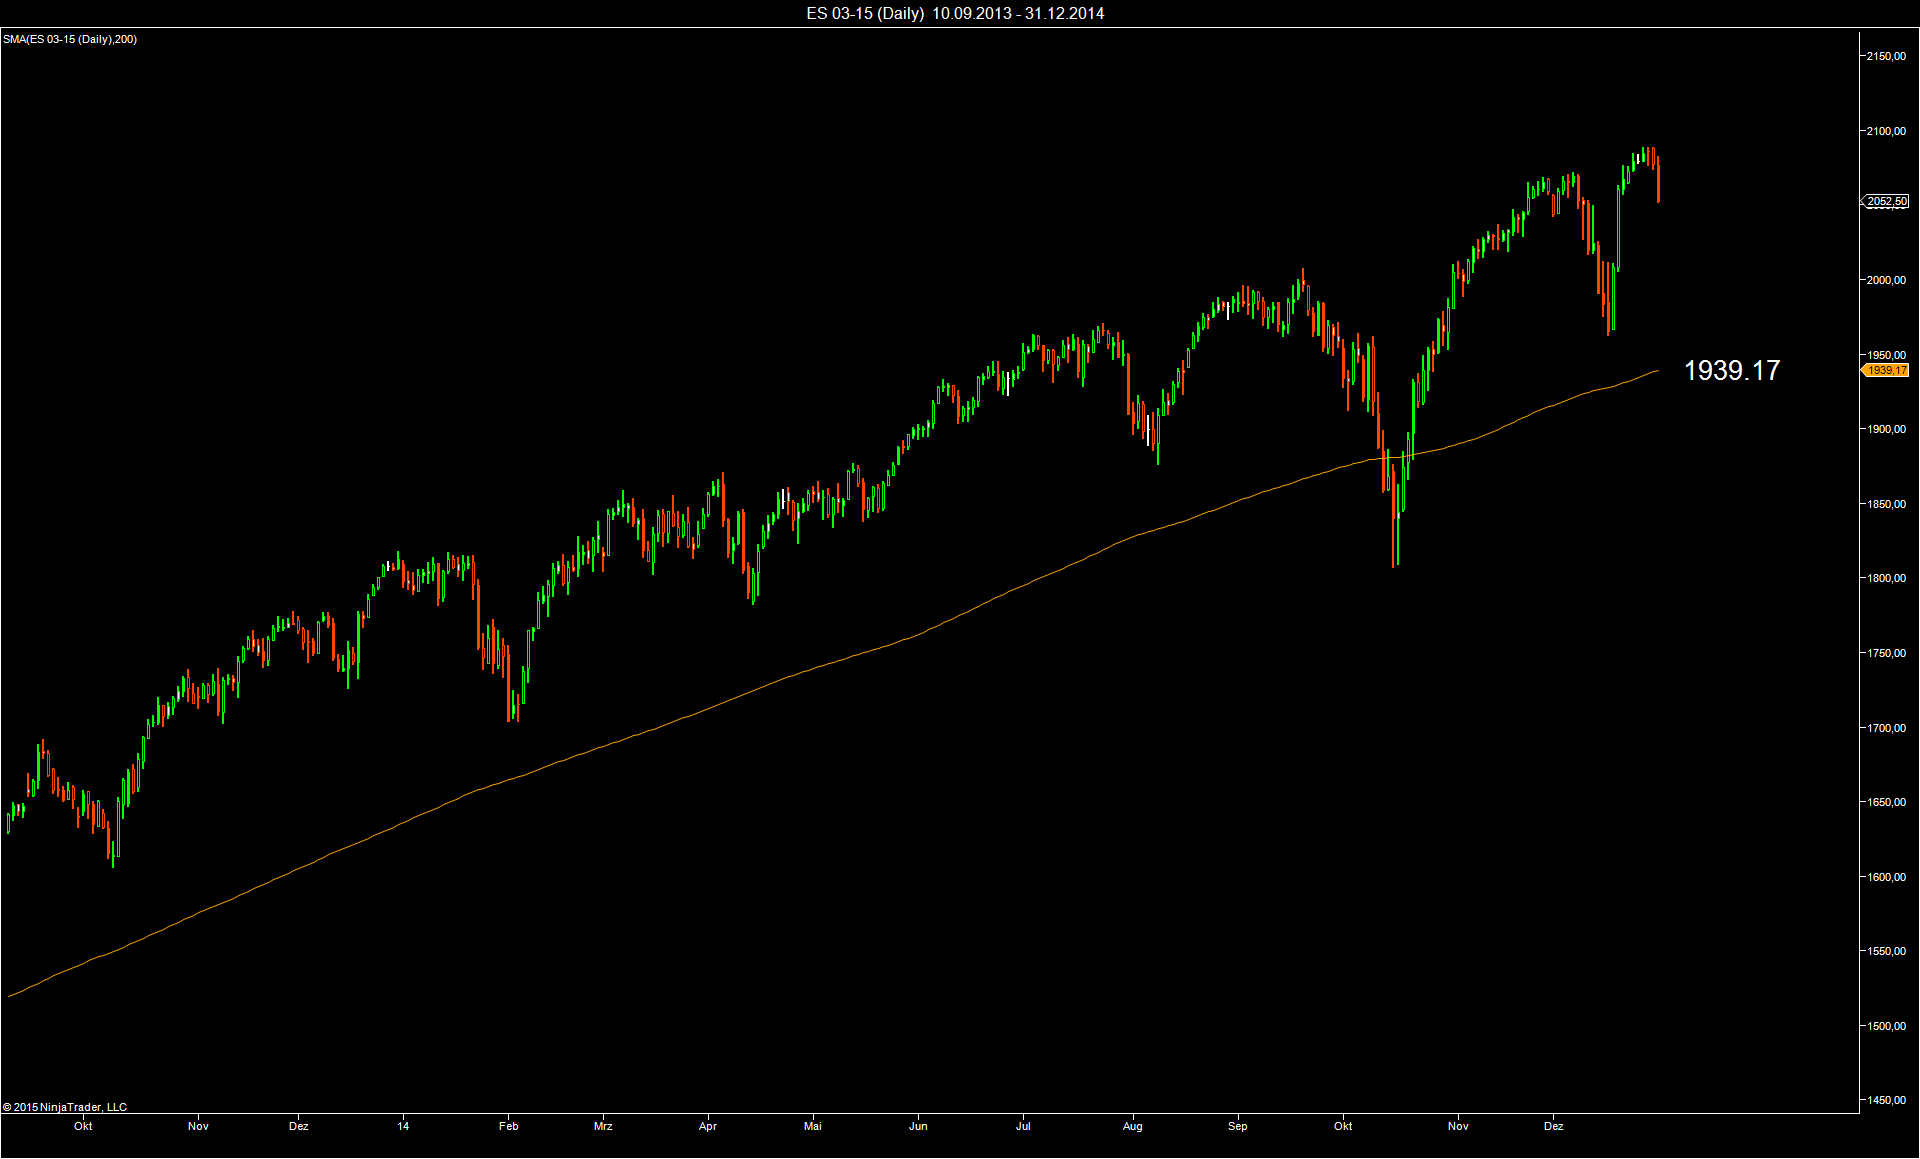
SMA(200) applied to a daily chart: The SMA is calculated from the settlement prices (depends on the datafeed) of the last 200 business days for which a settlement price has been determined.
The difference between the two values can be explained as follows:
The VisualSMA(200) uses the last traded price and not the settlement price
The daily SMA(200) does not use the values from Independence Day, Labor Day and Thanksgiving (no settlement price available) and therefore takes an additional three days from June to finish with 200 values.
This explains that the value comes out a few points lower.
|


