Welcome to NexusFi: the best trading community on the planet, with over 150,000 members Sign Up Now for Free
Genuine reviews from real traders, not fake reviews from stealth vendors
Quality education from leading professional traders
We are a friendly, helpful, and positive community
We do not tolerate rude behavior, trolling, or vendors advertising in posts
We are here to help, just let us know what you need
You'll need to register in order to view the content of the threads and start contributing to our community. It's free for basic access, or support us by becoming an Elite Member -- see if you qualify for a discount below.
-- Big Mike, Site Administrator
(If you already have an account, login at the top of the page)
It's always easy to be a Monday-morning quarterback, but here's how fibs based on the previous day and pivots together create zones that can be traded. I'm not an expert at trading S/R, which is why I started this thread, but these are some ideas as to how I would look at today's price action around these fib and pivot clusters.
This is comparable with the news that are used every day to explain why price has moved. With hindsight, every charts tells us a different story to show what happened.
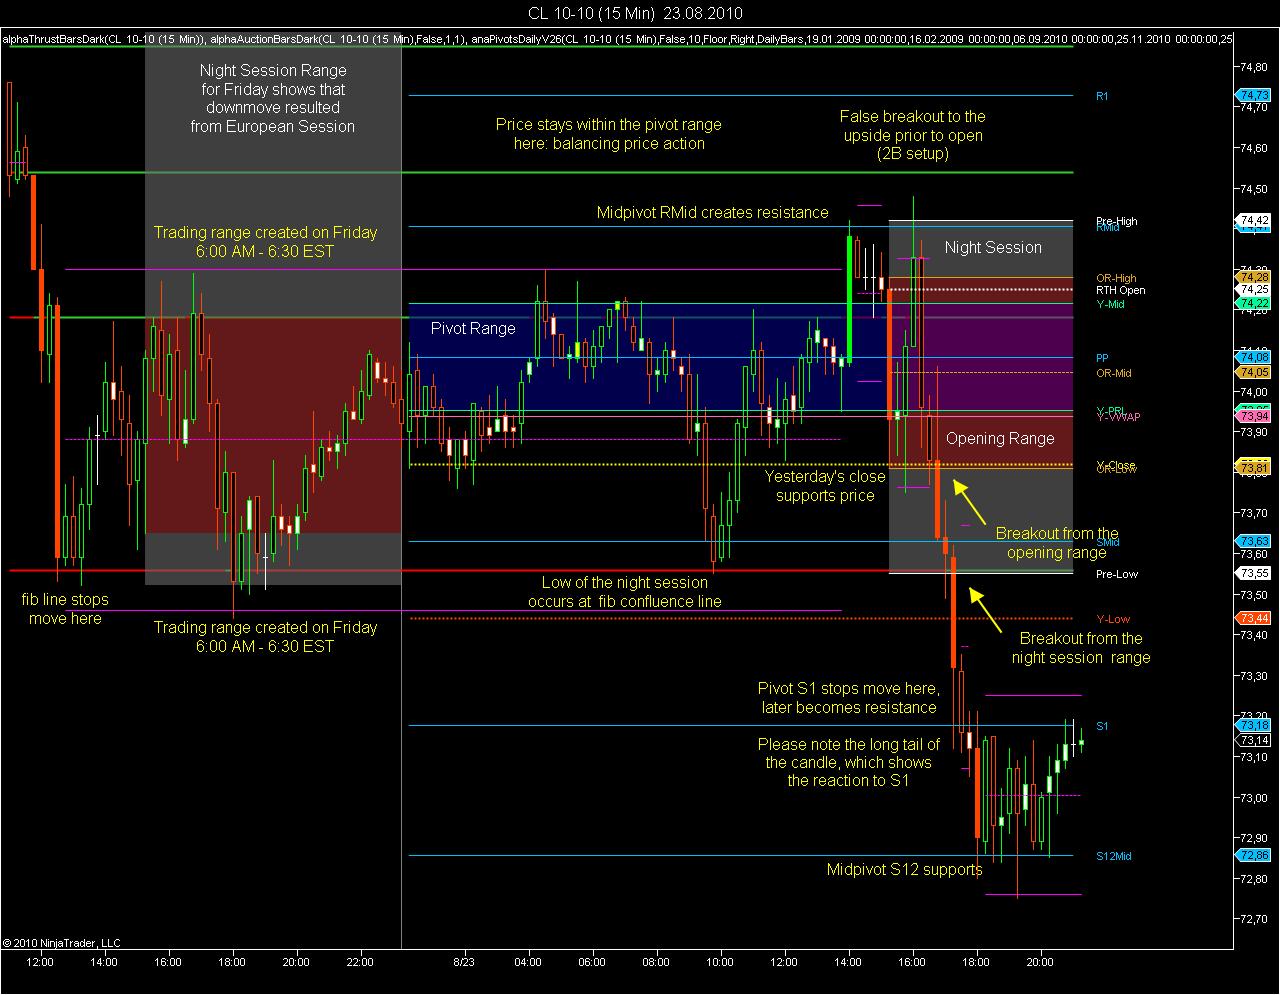
I do not use the US session pivots. Friday's move in crude prices was entirely made during the European Session. US session floor pivots completely ignored that Friday saw a considerable downmove shifting the value area by about 1 $/bbl. The pivot range in my chart is relatively wide, indicating that Friday did not close at the midline but had a down close. The opening range was situated around the pivot range, a false breakout to the upside cleared a price movement down. Note that the false breakout just carried above the opening and night session range, before quickly retracing southwards. This was a classical 2B setup at resistance. Would have been the best trade of the day.
During the further downmove both S1 and S12 acted as resistance.
If I look at your chart, all pivots were more or less ignored by price. Sorry, I think they are all in the wrong location. Wrong means that the majority of the traders does not use them.
Yes, the main pivot is a reference price for the prior session. Actually this reference is extended and you get the pivot range as shown. The method is well known by NYMEX traders. The second reference range is the price range shown on the chart that was created by price action on Friday morning 6:00 AM to 6:30 AM EST.
You will note that the setup of pivot range, opening range and night session range was really symmetrical. This shows balancing of the ongoing auction and can resolve to an upside or downside breakout. The breakout is only significant, if it exceeds a percentage of the prior range and is able to maintain that price level.
I hope that I did not create too much confusion with the chart and the comment.
If you don't use the US RTH session to compute your pivots, how do you compute your pivots? Do you just look at the times the largest meaningful move of the day was created and use that? Or do you always use a certain start/end session time other than the US RTH?
Originally floor pivots have been calculated for the floor session. But with the shift to electronic trading many instruments are traded round the clock and it simply does not make sense to use RTH pivots. Pivots are an instrument based on a reference price and volatility, both calculated from the prior day's range and close. If there is a large move during the European session as on Friday, I do not see a point to base the pivots on the US session, which was balancing of the prior move in price.
To calculate pivots, I use high, low and settlement price of the trading session. The trading session is defined by a common trade and settlement date. These values are daily published by CME and can be found here: Light Sweet Crude Oil
For CL 10-10, Monday's high, low and settlement are 74.48, 72.75 and 73.10 and the main pivot PP for Tuesday becomes 73.44 The Kinetick EOD data feed is based on these prices, so I simply connect to Kinetick-EOD first, then to my other data feed and use my pivots indicator in DailyBars mode.
Using the pivot in CalcFromIntradayData mode is not helpful, because it cannot catch the settlement price. The settlement price for CL is the VWAP between 2:28 PM and 2:30 PM EST, the session times are 6:00 PM to 5:15 PM EST. Settlement periods are listed here: Settlements
2. Pivot Range
The pivot range is an extended reference for the price action of the day. If the opening range is below the pivot range, this is bearish. If it is above it can be considered bullish. If the pivot range is narrow, it indicates that the prior day was a balancing day. This increases the odds for a trending move. If the pivot range is wide, this shows that the prior day closed near its high or low.
The pivot range is calculated from the prior day's midline = (High + Low)/2, which is mirrored through the main pivot. The pivot range therefore is contained between midline on the one side and mirrored midline = 2 PP - midline on the other side.
3. The 2B Setup
The 2B setup is a classical countertrade setup as described by Victor Sperandeo in his books Trader Vic and Trader Vic II. It is similar to the Turtle Soup setup of Linda Raschke. I have attached a document by Suri Duddella explaining the 2B pattern below. For a good summary on all classic chart patterns, see the book of Suri Duddella, which is also recommended by Big Mike on the book thread.
shodson if you would like to learn how to trade with only fibs shoot me a PM and i can show you how to trade them. everything im looking at here is just making something simple to do very complicated. there are only a very few amount things you need to know about trading with fibs.
the way i trade using fibs is not something i can just write down here and people would understand what im doing. they would actually have to see it and hear it explained to them.
Perhaps a brief outline / summary of your methods first would be a good way to get folks interested and then you could follow on with the PM approach.Just a thought as this is such a great sharing forum.
Well just a basic rundown is i use the 50% as the buy/sell area and the 61.8% as failure of the trend and the -23% and -61.8% as my targets once in a trade. The most important thing about fibs is actually knowing where to anchor them from